
Equity markets tried to bounce back last night, but Wall Street was a bit of a wet blanket with only modest bounces after critical support levels were broken earlier in the week and remain untouched. The bond market firmed somewhat instead with 10 year US Treasury yields roundtripping to fall back to the 2.9% level while the USD firmed against everyything yet again, with Euro deflating slightly and the Australian dollar remaining below the 70 handle. d inflation! Commodity prices were hit hard too, with oil prices falling back more than 6%, while gold continues to deflate well below the $1900USD per ounce level, making a new monthly low.
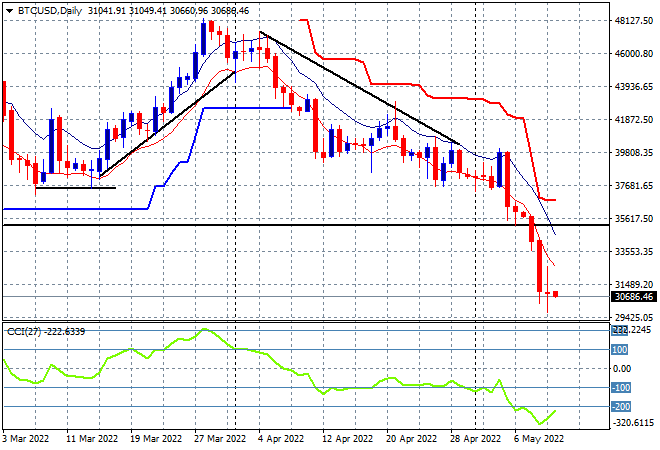
Bitcoin continues its capitulation, finishing just above the $30K level this morning after breaking the February lows/weekly support level previously. Momentum is extremely oversold so there is the potential for a short term swing back as price gets too far away from the downtrend line:
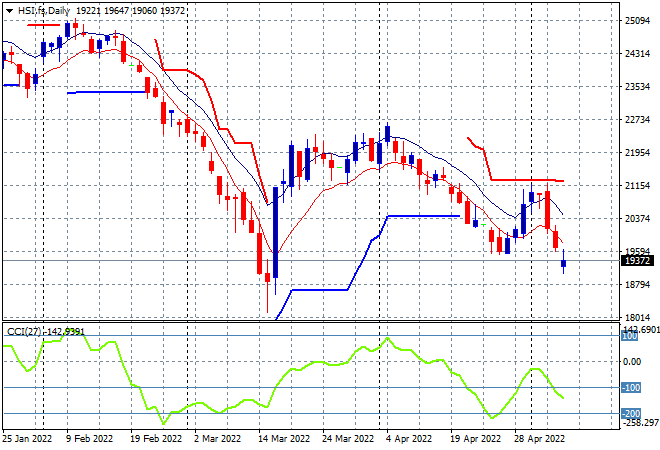
Looking at share markets in Asia from yesterday’s session, where mainland Chinese share markets were able to recover their early losses with the Shanghai Composite currently up 0.7% at 3025 points while the Hang Seng Index returned from its holiday to a large selloff, down more than 2% to 19549 points. The daily chart shows price action inverting again after coming up against the trailing daily ATR resistance at the 21000 point level but failing to punch through as the overall picture still points to a return to the early March lows at 18000:
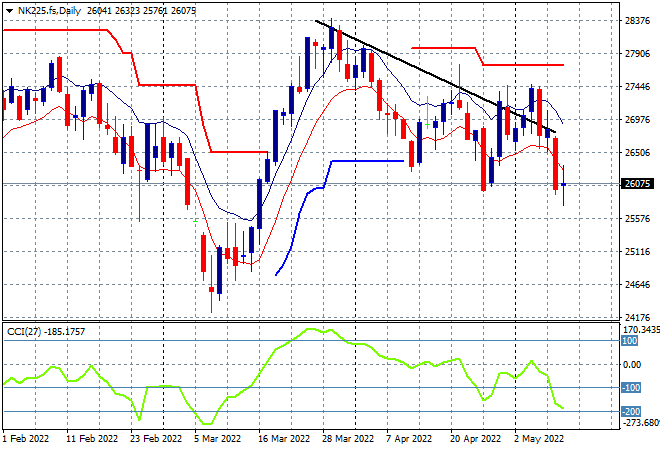
Japanese stock markets were still under threat with the Nikkei closing 0.6% lower at 26167 points. The daily chart of the Nikkei 225 is showing a bearish descending triangle here with the weaker Yen not helping at all. The failure to break out above the previous daily highs near the 27500 point level will confirm a return to the downward trend from the March highs, so watch for a break of the 26000 point proper:
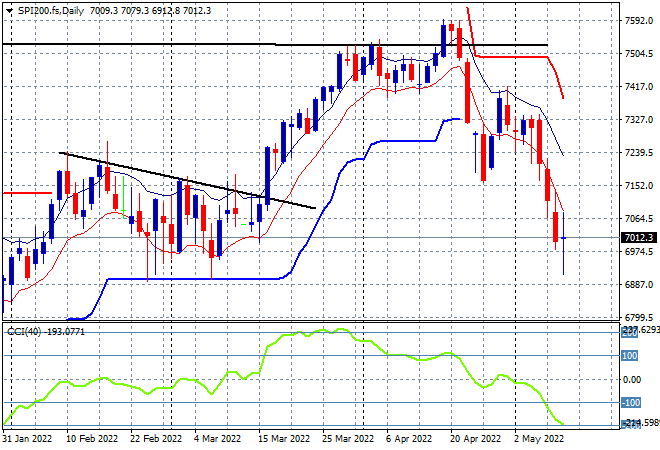
Australian stocks started off in a shocking state but were able to clawback throughout the afternoon with the ASX200 finishing down nearly 1% proper at 7051 points. SPI futures are down about 10 points, still confused on direction as overnight volatility spiked, as there’s a definite lack of confidence brewing. The daily chart is broadcasting a breach of the weekly lows around the 7000 point level and possibly a further correction through to the 6700 point level:
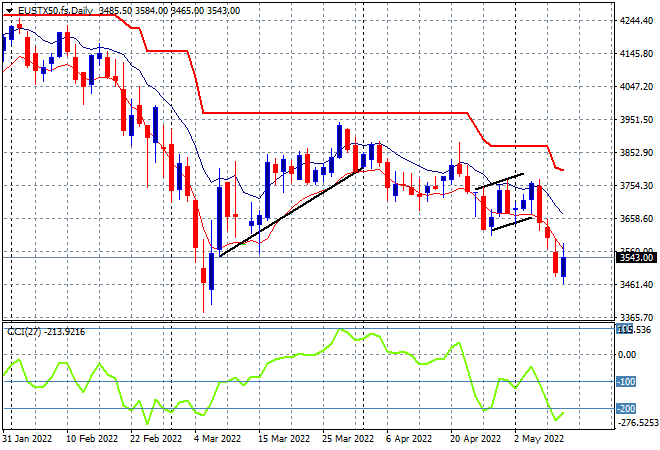
European shares initially broke out with a big bounce, up more than 1-2% across the continent but gave up much of those gains going into the close with the Eurostoxx 50 index finishing just 0.8% higher at 3554 points. The daily chart picture remains bearish and the March lows still beckon with daily momentum remaining very oversold with a very slight chance of a short term swing play here that could be a bull trap:
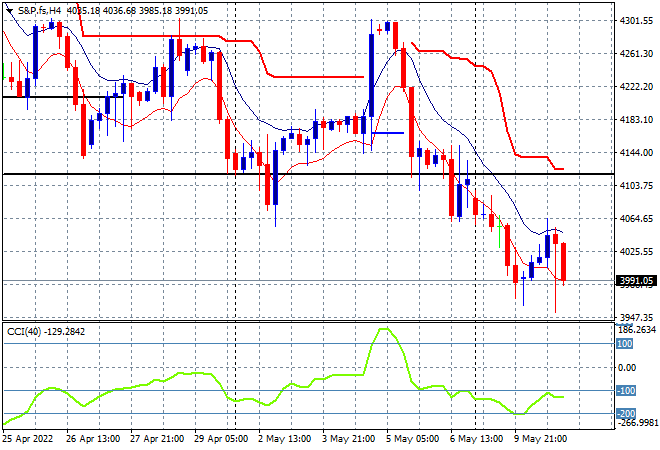
Wall Street was the drag on the bounceback last night, with the headline Dow off, while the NASDAQ managed to lift nearly 1%, the S&P500 barely made into positive territory, finishing up 0.3% to just pip above the 4000 point key support level. However, most of this gain was lost in post close futures and the technical picture does not look good on the four hourly chart with a failure to breach the high moving average or crossover from oversold momentum. I think this is just another pause in the correction that will widen from here:
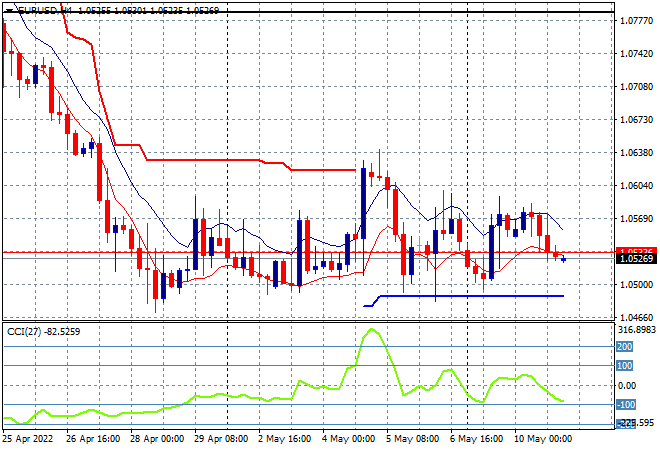
Currency markets are still relatively quiet despite other risk markets putting in very high levels of volatility post last week’s Fed meeting and especially Friday night’s NFP print. Euro deflated somewhat overnight on the ZEW survey print, confirming its anchoring around the weekly low at the 1.05 handle. Short term momentum is slowly moving back to negative settings but not quite oversold yet, with the trailing ATR resistance level at the 1.06 handle still proving too strong, so watch for any attempt to selloff below the 1.05 level next:
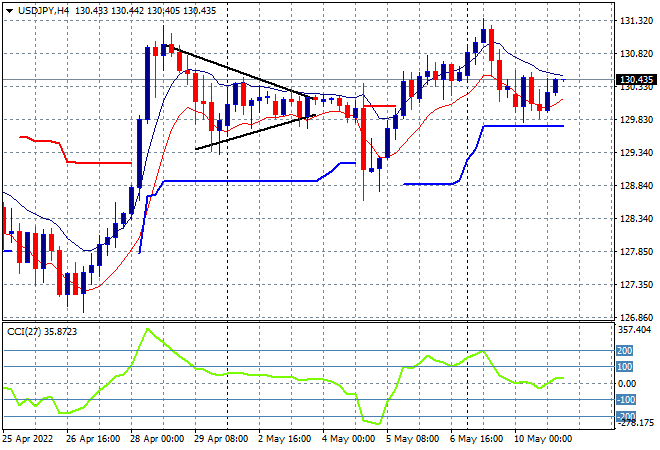
The USDJPY pair is consolidating here after its recent failure to make a new weekly high following the Fed meeting volatility, back finding a lot of support around the 130 handle, as it continues a very sideways bullish bias. Short term momentum has retraced back from overbought levels but remains positive as price also stays above trailing ATR support as a result, so watch for a break above the high moving average on the four hourly chart for another attempt at the 131 level:
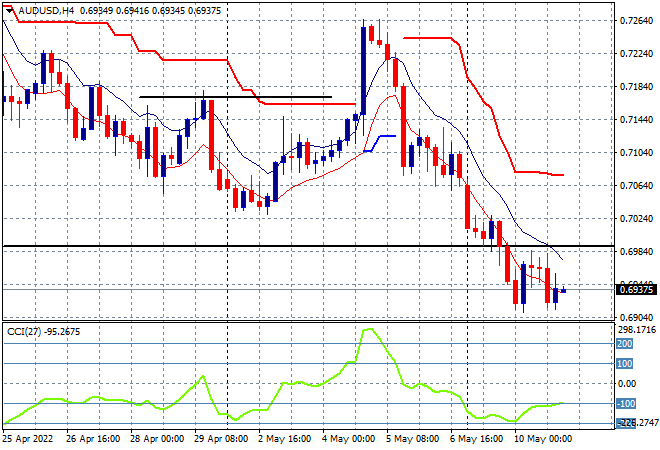
The Australian dollar remains in smack down mode, still pushed well below the 70 handle but contained without any new session lows as the daily chart shows key weekly support still fully broken. My contention of a rollover back down to the key 70 handle and then into the 60’s continues to hold here with the longer term bearish picture coming to fruition as part of a multi month technical setup. Watch for any break below the recent session lows at the 69 level proper as short term momentum remains nicely oversold:
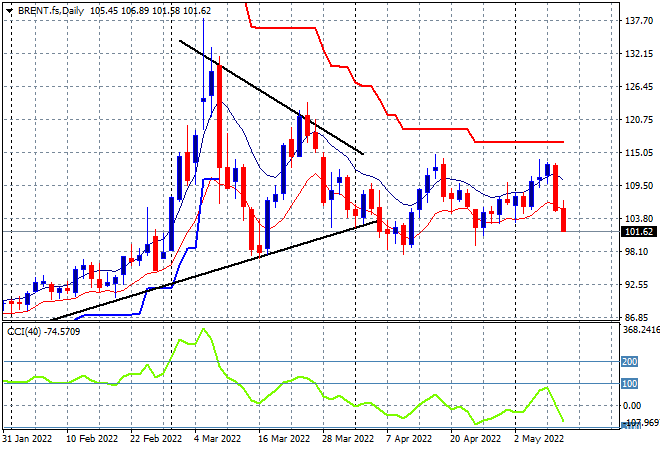
Oil markets have rolled over following the fake breakouts of previous weeks, with Brent falling more than 3% to retreat to the $101USD per barrel support level overnight. Daily momentum has now flopped to a negative setting with the previous bearish engulfing candle having nearly taking out weekly support. My contention of a breakdown below the key $100 level is firming here, with the $98 level the actual one to watch:
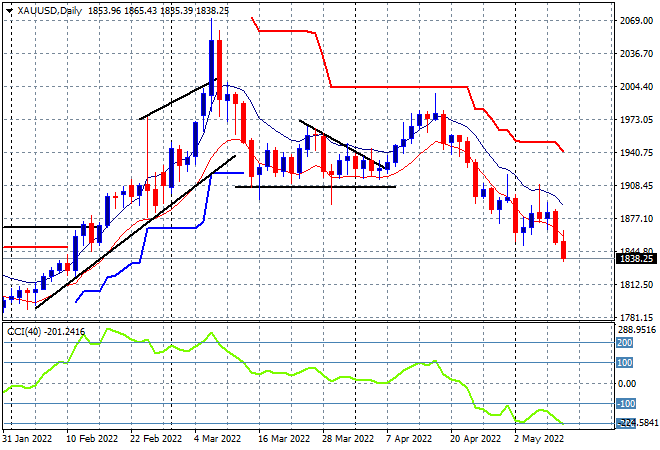
Gold is still under the pump with more selling overnight, finishing at the $1838USD per ounce level, being contained well below the $1900USD per ounce level which continues to prove itself as strong resistance. This downtrend is entrenched as daily momentum remains stuck in oversold territory with the January lows around the $1800 level the next possible downside target:
Glossary of Acronyms and Technical Analysis Terms:
ATR: Average True Range – measures the degree of price volatility averaged over a time period
ATR Support/Resistance: a ratcheting mechanism that follows price below/above a trend, that if breached shows above average volatility
CCI: Commodity Channel Index: a momentum reading that calculates current price away from the statistical mean or “typical” price to indicate overbought (far above the mean) or oversold (far below the mean)
Low/High Moving Average: rolling mean of prices in this case, the low and high for the day/hour which creates a band around the actual price movement
FOMC: Federal Open Market Committee, monthly meeting of Federal Reserve regarding monetary policy (setting interest rates)
DOE: US Department of Energy
Uncle Point: or stop loss point, a level at which you’ve clearly been wrong on your position, so cry uncle and get out!wrong on your position, so cry uncle and get out!