
Another bath of blood on Wall Street overnight as critical support levels were broken across almost all risk markets, tipping us into bear market territory. This follows Friday night’s reaction to the solid US jobs report as the Fed will not be swayed from its aggressive rate rise agenda. 10 year US Treasury yields fell back from the 3.2% level so at least some assets appreciated, but another 50 point rise remains baked in for the next Fed meeting. The USD closed only slightly up against Euro but risk proxies like the Australian and Canadian dollar were smashed, the former pushed into the mid 69’s – here comes the imported inflation! Commodity prices were hit hard too, with oil prices falling back more than 6%, while gold continues to deflate well below the $1900USD per ounce level, making a new monthly low.
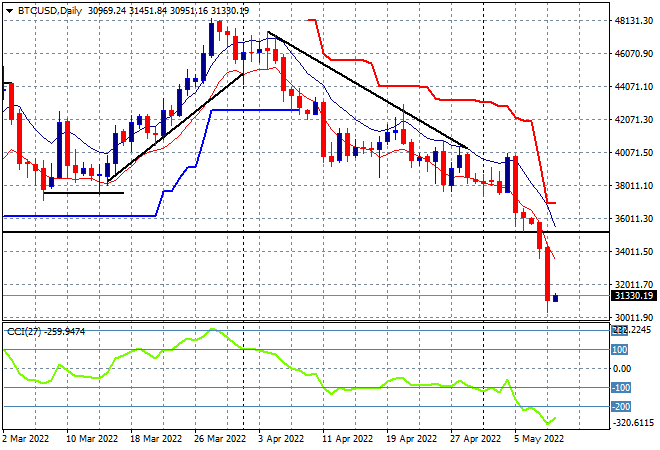
Bitcoin has capitulated (you’ll hear that word often today) with a swift 10% collapse through the February lows to end up just above the $30K level this morning. As I said yesterday, if the February lows/weekly support level was breached, its game over, so here we are:
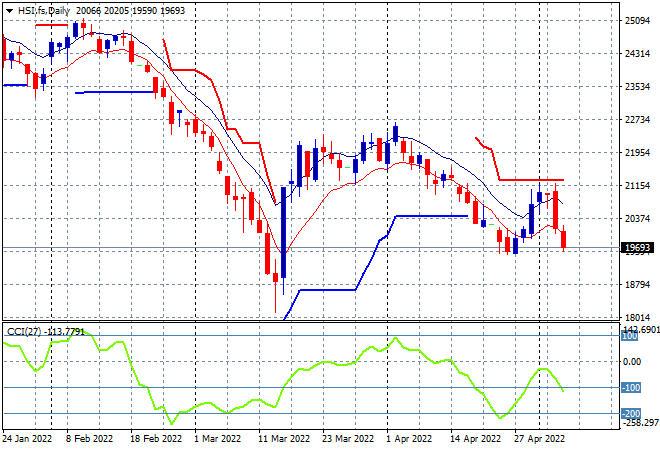
Looking at share markets in Asia from yesterday’s session, where mainland Chinese share markets basically treaded water with the Shanghai Composite putting in a scratch session at 3004 points while the Hang Seng Index is closed for the National Day holiday. The daily chart was showing a potential swing trade brewing here as price action came up against the trailing daily ATR resistance at the 21000 point level, but the overall picture still points to a return to the early March lows at 18000 as momentum inverts, so watch for any falls through the previous daily low at 19600 points:
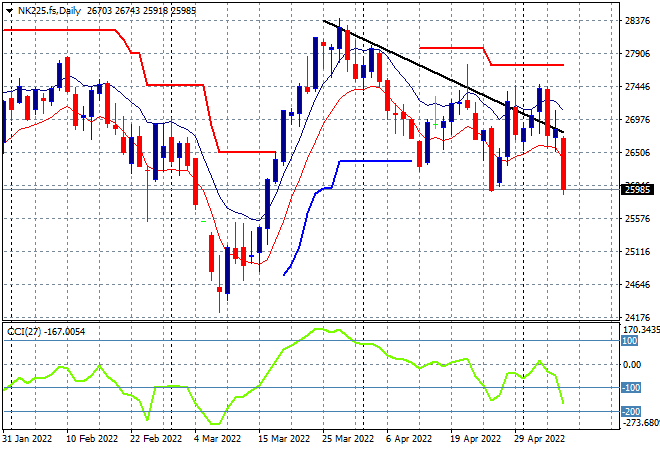
Japanese stock markets played catchup on risk aversion with the Nikkei closing 2.5% lower at 26319 points. The daily futures chart of the Nikkei 225 was showing somewhat of a consolidation here as the weaker Yen kept risk spirits elevated, but the failure to break out above the previous daily highs near the 27500 point level will confirm a return to the downward trend from the March highs. Futures are indicating a grim start to the trading session today:
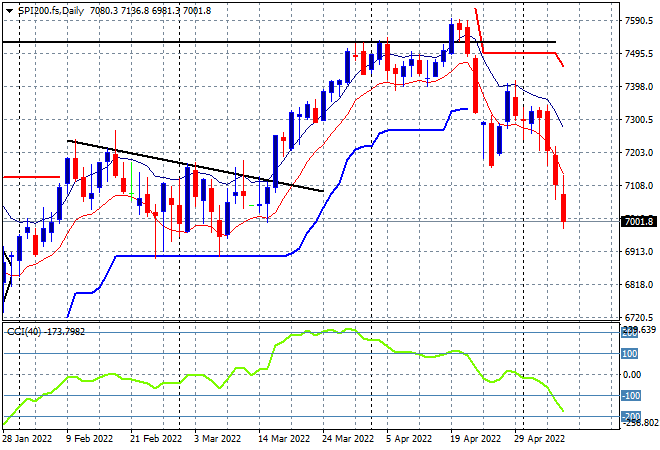
Australian stocks could not escape the risk aversion either with the ASX200 down more than 1.2% to close at 7120 points. SPI futures are down nearly 100 points or well over 1% so the selling is likely to continue as confidence completely evaporates. The daily chart is broadcasting a breach of the weekly lows around the 7000 point level and possibly a further correction through to the 6700 point level:
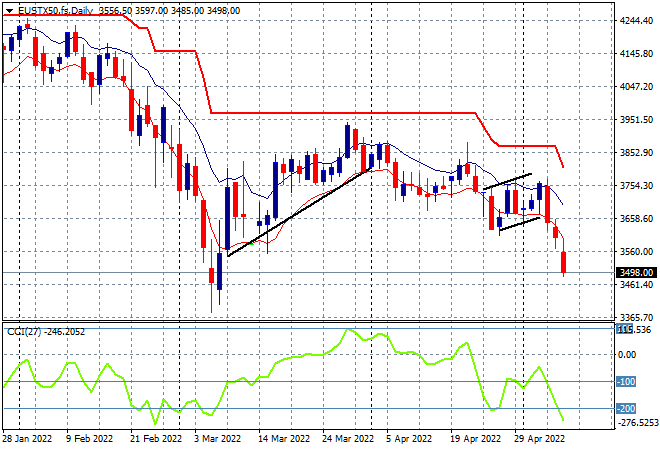
European shares had a very bad trading session across the continent with the Eurostoxx 50 index closing nearly 3% lower at 3526 points, with broad losses across all markets. The daily chart picture was looking quite bearish before all this and my prediction of an improbable return to any price action around trailing daily ATR resistance at the 3800 level is coming to fruition here. The March lows beckon and possibly break below that as recession/stagflation fears mount:
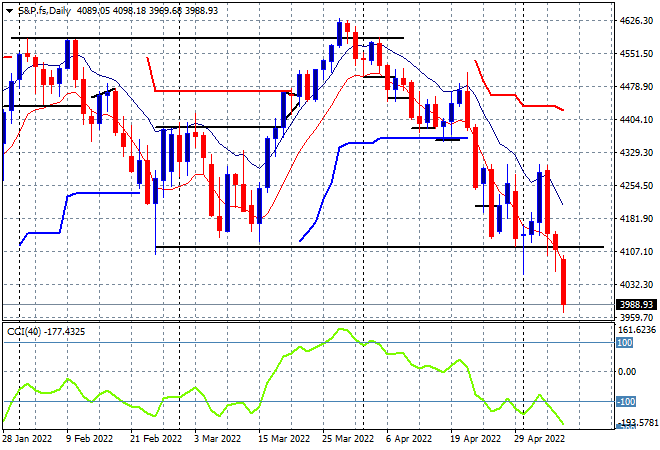
Wall Street was were the main damage occurred, with the NASDAQ capitulating and losing more than 4% while the S&P500 fell over 3% to close below the 4000 point key support level, finishing at 3991 points. Yesterday I mentioned the ugly stick was ready to start hitting traders as the daily chart showed price about to break key support at the 4100 point level and now we’ve seen a breach of 4000 points and weekly support so a further correction is increasingly likely:
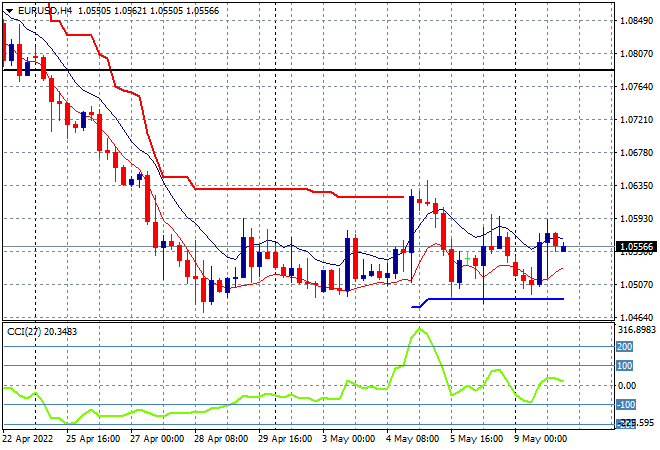
Currency markets remain relatively quiet given all the hoopla on stock markets post the Fed meeting and Friday night’s NFP print, although this is largely contained to Euro as it remains anchored at its weekly low at the 1.05 handle. Short term momentum is back at neutral settings with the trailing ATR resistance level at the 1.06 handle still proving too strong, so watch for any attempt to selloff below the 1.05 level next:
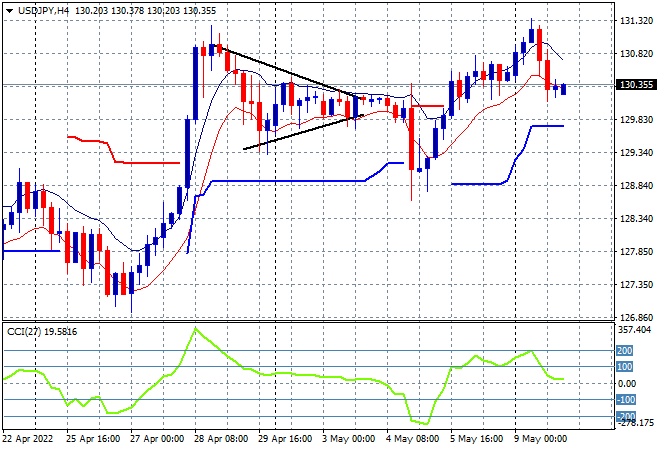
The USDJPY pair has tried to make a new weekly high following the Fed meeting volatility, getting above the 131 handle overnight before smacked down to the low 130’s this morning on the risk-off trade, but remains in a very sideways bullish bias here. Short term momentum has retraced back from overbought levels but remains positive as price also stays above trailing ATR support as a result:
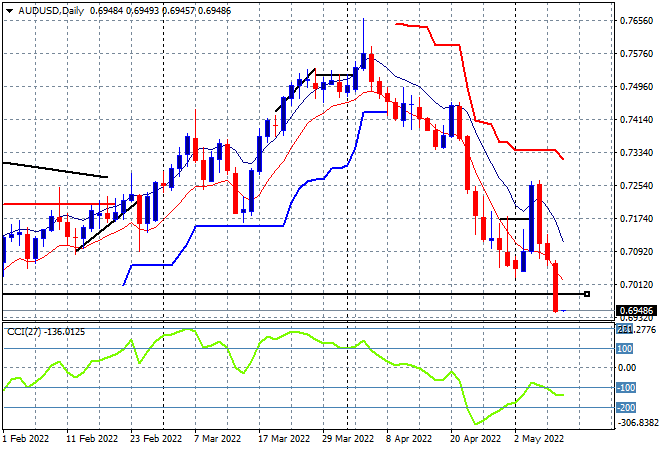
The Australian dollar is in smack down mode, pushed well below the 70 handle as the daily chart shows key weekly support now fully broken. My contention of a rollover back down to the key 70 handle and then into the 60’s has held here with the longer term bearish picture coming to fruition as part of a multi month technical setup – it will get worse from here as the RBA is months and months behind the curve:
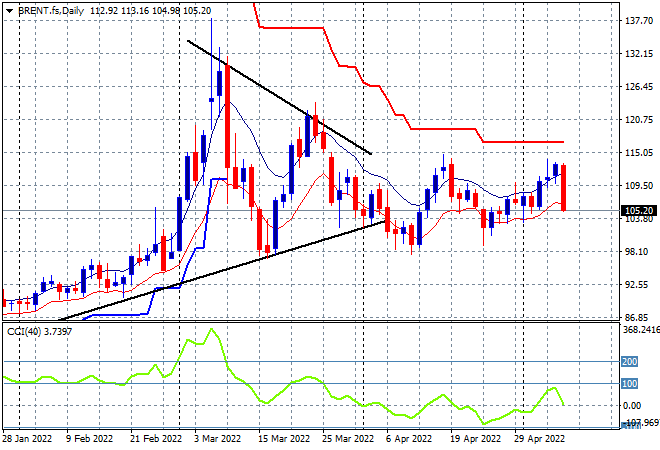
Oil markets were ready for another liftoff despite overall risk volatility and have played catchup overnight with Brent falling more than 6% to start the week in poor form at the $105USD per barrel support level. Daily momentum has been pushed back to a neutral setting with the bearish engulfing candle nearly taking out weekly support as my contention of a breakdown below the key $100 level gains traction. The lack of a new weekly high will see more long positions wound back swiftly so watch for any pressure below the 103 level:
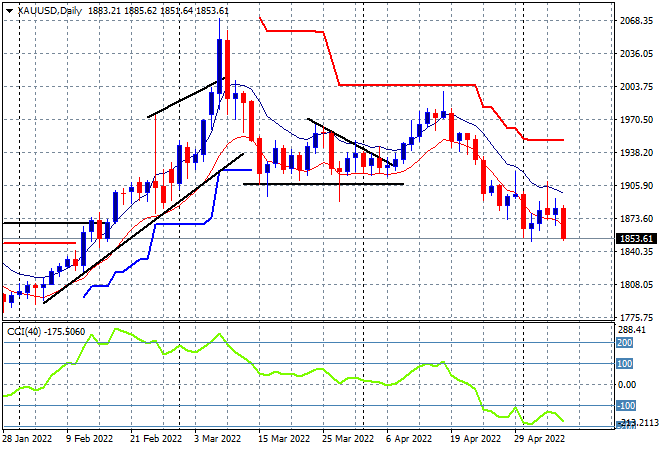
Gold is still under the pump with a lot of selling overnight contained well below the $1900USD per ounce level which has proved itself as strong resistance, finishing at the $1853 level. This is now a proper downtrend as daily momentum remains stuck in oversold territory with the January lows around the $1800 level the next possible downside target:
Glossary of Acronyms and Technical Analysis Terms:
ATR: Average True Range – measures the degree of price volatility averaged over a time period
ATR Support/Resistance: a ratcheting mechanism that follows price below/above a trend, that if breached shows above average volatility
CCI: Commodity Channel Index: a momentum reading that calculates current price away from the statistical mean or “typical” price to indicate overbought (far above the mean) or oversold (far below the mean)
Low/High Moving Average: rolling mean of prices in this case, the low and high for the day/hour which creates a band around the actual price movement
FOMC: Federal Open Market Committee, monthly meeting of Federal Reserve regarding monetary policy (setting interest rates)
DOE: US Department of Energy
Uncle Point: or stop loss point, a level at which you’ve clearly been wrong on your position, so cry uncle and get out!wrong on your position, so cry uncle and get out!