
Following the previous flop on Thursday night, Wall Street was able to recover somewhat on Friday with only minor losses although the tech heavy NASDAQ is now pushing into bear market territory. The latest US jobs report was pretty solid and kept the sellers energised as the Fed will not be swayed from its aggressive rate rise agenda. Euoropean shares were still in retreat mode however as concerns over the broadening energy crisis remain. 10 year US Treasury yields returned back to the 3.1% level with another 50 point rise baked in for the next Fed meeting, as the USD closed only slightly down but still at a 20 year plus high against nearly everything, with the Australian dollar pushed below the 71 handle. Commodity prices saw a big move higher in oil, with Brent back up to the $113USD per barrel level, while gold continues to oscillate as the $1900USD per ounce level turns into strong resistance.
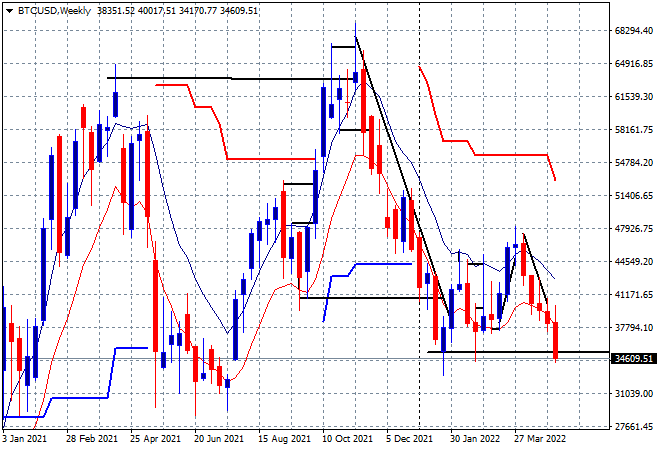
Bitcoin continues to deflate and has fully returned to its downward trend from its March highs, after making a false break on the Fed rate rise exuberance. My contention of the prior moves building for a further retracement down to the February lows at the $37K level has shown through here, with new lows made in the process as the $30K target is building next. The weekly chart shows if that level is breached, its game over:
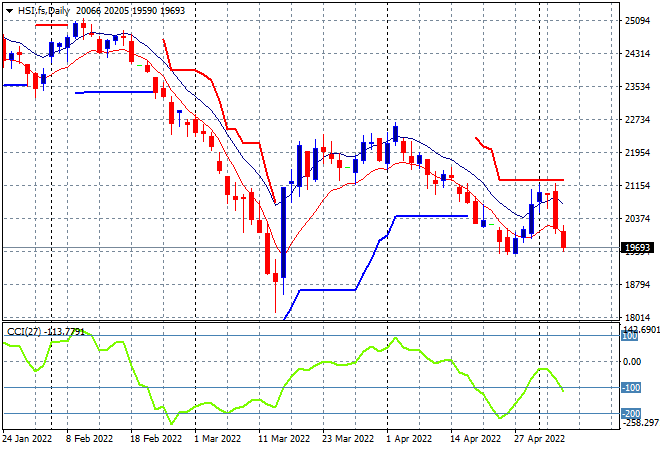
Looking at share markets in Asia from Friday’s session, Chinese share markets were hit hard with the Shanghai Composite down a little more than 2% to 3001 points while the Hang Seng Index was also punished, off by nearly 4% to 20001 points. There’s some curious levels that were managed….. The daily chart was showing a potential swing trade brewing here as price action came up against the trailing daily ATR resistance at the 21000 point level, but the overall picture still points to a return to the early March lows at 18000 as momentum inverts:
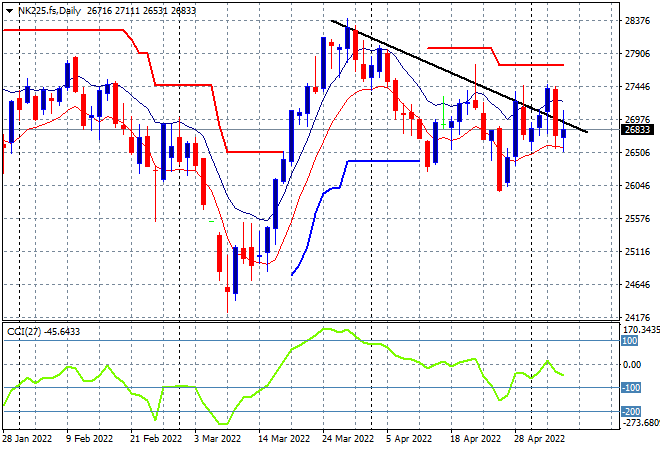
Japanese stock markets reopened without much fuss at all as the Nikkei 225 at first looked to close with a scratch session before a late rally saw it close up 0.6% to 27003 points. The daily futures chart of the Nikkei 225 is showing somewhat of a consolidation here as the weaker Yen keeps risk spirits elevated, but the failure to break out above the previous daily highs near the 27500 point level will confirm a return to the downward trend from the March highs. Watch for a break below the 26500 level:
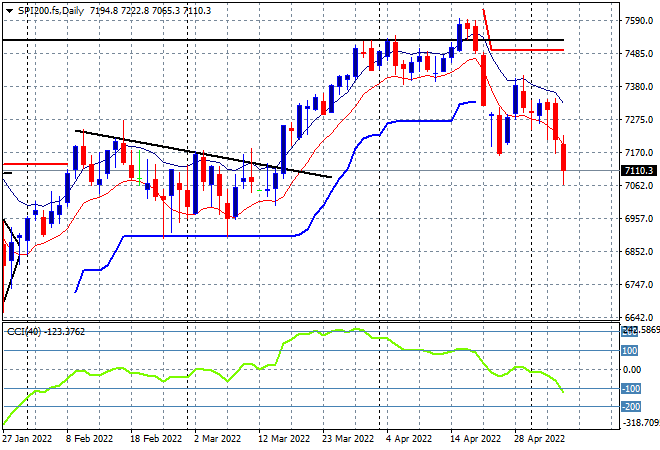
Australian stocks were hammered from the Thursday night rout, with the ASX200 down more than 2% at the close, finishing the week at 7205 points. SPI futures are down nearly 50 points so the selling is likely to continue as we start the new trading week. The daily chart is not looking good at again with a return to the weekly lows around the 7000 point level most probable as momentum goes oversold:
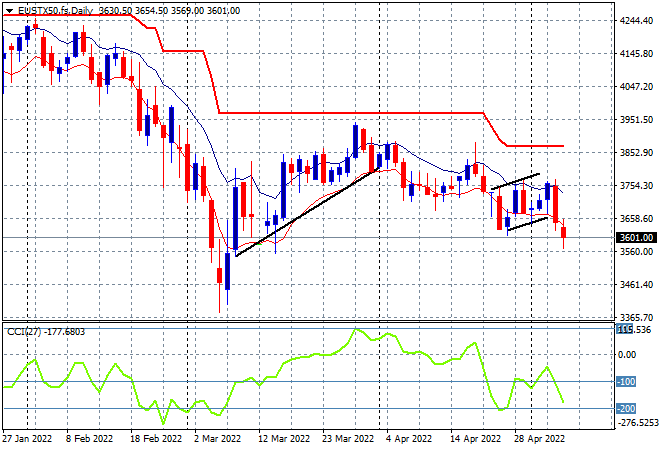
European shares had another poor trading session across the continent with the Eurostoxx 50 index closing nearly 1.8% lower at 3629 points. The daily chart picture still looks quite bearish as futures indicate some pressure building here at the supposed bottom at the 3600 point level. I still don’t think we’ll see a return to any price action around trailing daily ATR resistance at the 3800 level as daily momentum is likely to go very oversold soon- again flip this chart and you’d be a buyer:
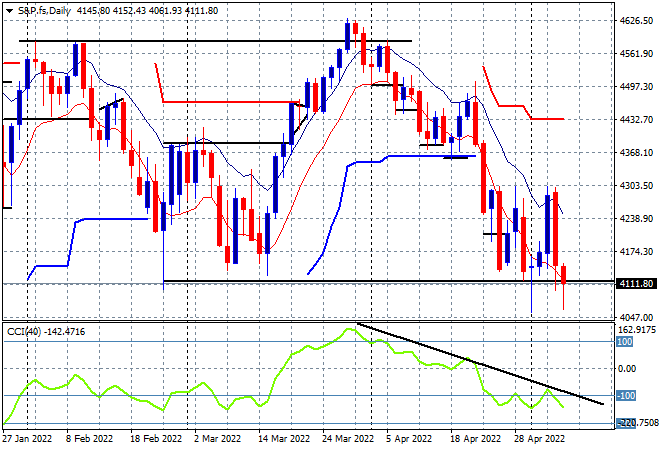
Wall Street also put in losses across the board, but it was more diverse with the NASDAQ losing 1.5% while the S&P500 fell just 0.5% to close at 4123 points as the impact of the latest NFP print was felt. Price action on the four hourly chart was possibly building an inverse head and shoulders pattern to set up for a new rally here, but this was transitory at best as caution pays off with a failure to breach last week’s high the telling point. This could get ugly as the daily chart shows price about to break key support at the 4100 point level and a return down to 4000 points increasingly likely:
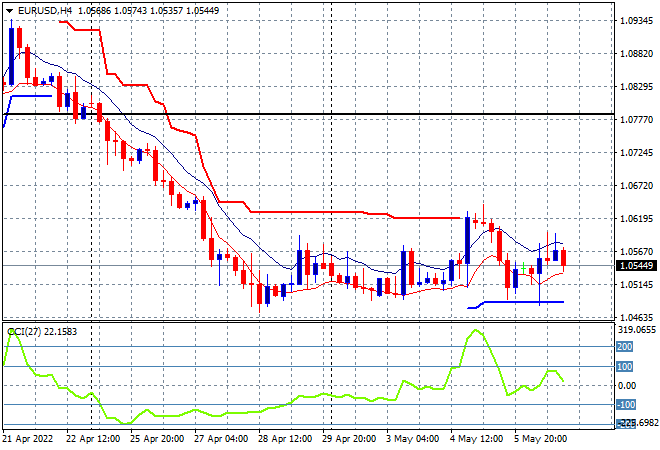
Currency markets have quietened down after absorbing the strong USD oscillation post the Fed meeting with Friday night’s NFP print not upsetting the Euro too much as it remains anchored at its weekly low at the 1.05 handle. Short term momentum is back at neutral settings with the trailing ATR resistance level at the 1.06 handle still proving too strong, so watch for any attempt to selloff below the 1.05 level next:
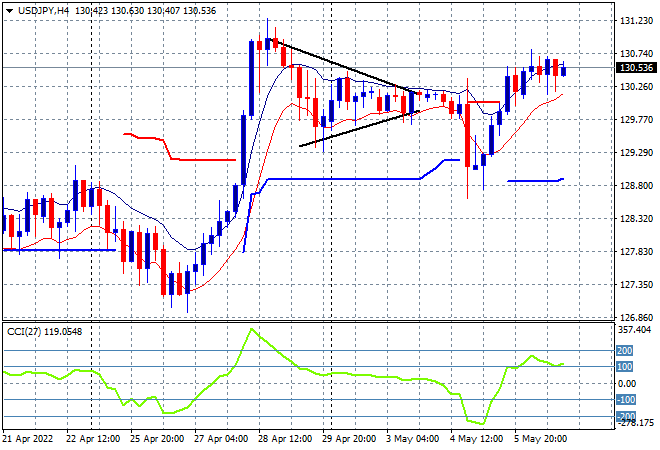
The USDJPY pair was able to consolidate above the 130 level, not quite making a new weekly high but remaining strong in the process following the Fed meeting volatility. The sideways bullish bias is still valid here with four hourly momentum back to overbought levels and ready to engage higher as a result:
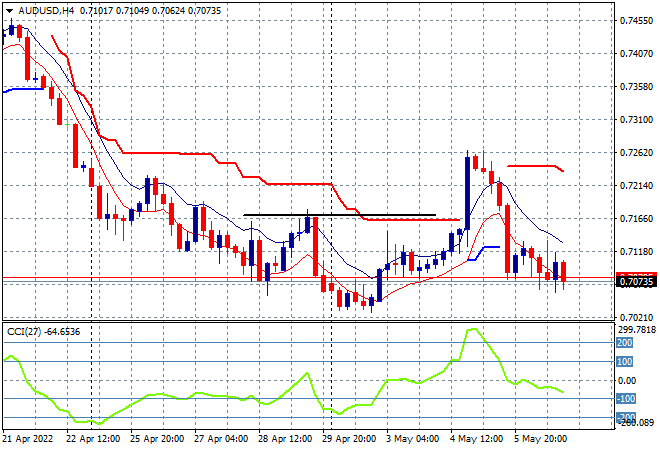
The Australian dollar has been smacked back down to its proper course, finishing the week just below the 71 level again, almost matching the start of week low point after the huge breakout midweek on the Fed rate moves. My contention of a rollover back down to the key 70 handle and then into the 60’s still holds, as the potential rollover after the excitement of the Fed rate rise has occured so watch for any weakness down to the 70 level proper today:
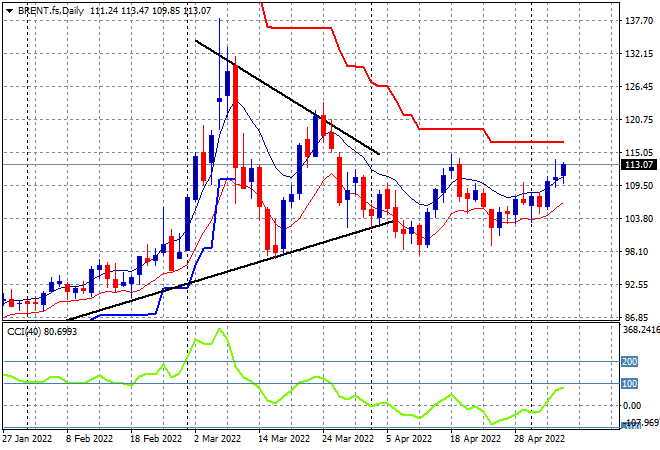
Oil markets are ready for another liftoff despite overall risk volatility with Brent lifting more than 2% to finish the week at the $113USD per barrel support level. Daily momentum is well into the positive zone and almost overbought as price action has matched but not yet exceeded the previous daily high in mid April. There still remains the possibility of a drawback or breakdown below the key $100 level gaining traction, so a new weekly high is required very soon or long positions will be wound back swiftly:
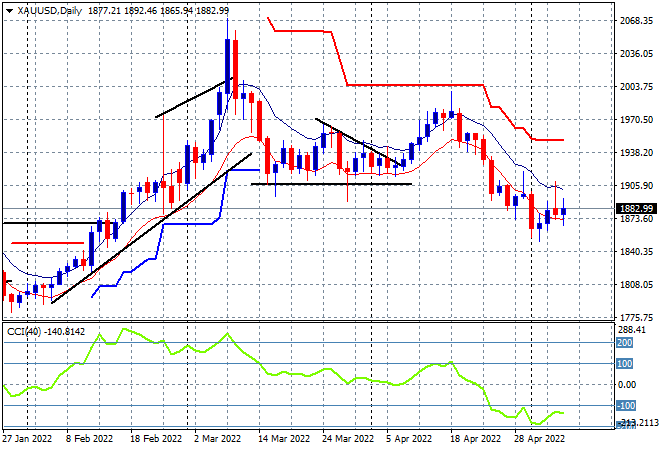
Gold is still under the pump with a lot of intrasession selling keeping it well contained below the $1900USD per ounce level which has proved itself as strong resistance, finishing at the $1882 level on Friday night. It remains to be seen if this will return to a new downtrend but all the signs are there as daily momentum hasn’t budged out of oversold territory with the January lows around the $1800 level the next possible downside target:
Glossary of Acronyms and Technical Analysis Terms:
ATR: Average True Range – measures the degree of price volatility averaged over a time period
ATR Support/Resistance: a ratcheting mechanism that follows price below/above a trend, that if breached shows above average volatility
CCI: Commodity Channel Index: a momentum reading that calculates current price away from the statistical mean or “typical” price to indicate overbought (far above the mean) or oversold (far below the mean)
Low/High Moving Average: rolling mean of prices in this case, the low and high for the day/hour which creates a band around the actual price movement
FOMC: Federal Open Market Committee, monthly meeting of Federal Reserve regarding monetary policy (setting interest rates)
DOE: US Department of Energy
Uncle Point: or stop loss point, a level at which you’ve clearly been wrong on your position, so cry uncle and get out!wrong on your position, so cry uncle and get out!