
What the hell was that? Wall Street completely flopped overnight with the NASDAQ losing 5%, the S&P500 down over 3% in a big reversal from the post-Fed exuberance. This is unsettling given the only couple times this has happened before was early 2008 and early 2020 before well, you know.. Bond markets saw a big selloff as well with 10 year US Treasury yields jumping up to the 3.1% level as the USD screamed back to its 20 year plus high against nearly everything, with the Australian dollar sold off very sharply as a result. Commodity prices whiplashed with some minor up movement on oil markers, while copper and gold pulled back alongside iron ore.
This is not going to be a pretty last session of the trading week for Asia today.
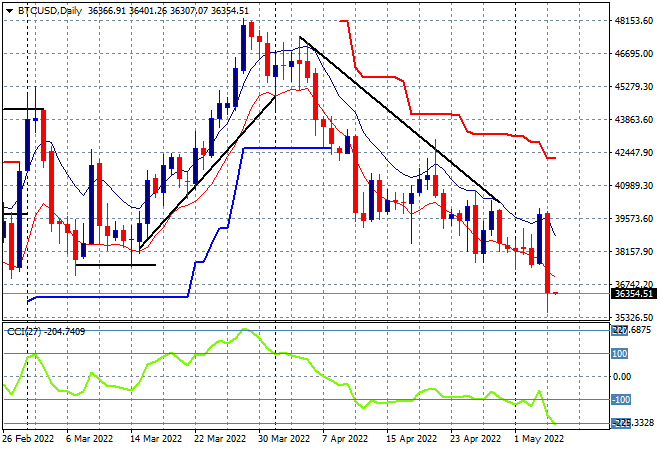
Crypto markets flopped more than twice that of stocks with Bitcoin down over 10% and returning to its downward trend from its March highs, after making a false break on the Fed rate rise exuberance. My contention of the prior moves building for a further retracement down to the February lows at the $37K level has shown through here, with new lows made in the process as the $30K target is building next:
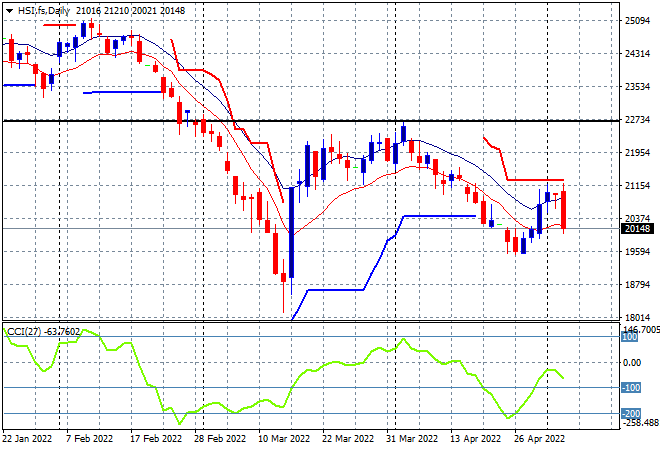
Looking at share markets in Asia from yesterday’s session,Chinese share markets finally reopened after a big break with the Shanghai Composite playing catchup, closing up 0.7% to 3068 points while the Hang Seng Index tried to regain its previous losses, up nearly 0.5% at one stage before selling off at the close to finish down 0.4% at 20793 points. The daily chart was showing a potential swing trade brewing here as price action came up against the trailing daily ATR resistance at the 21000 point level, but the overall picture still points to a return to the early March lows at 18000 as momentum inverts:
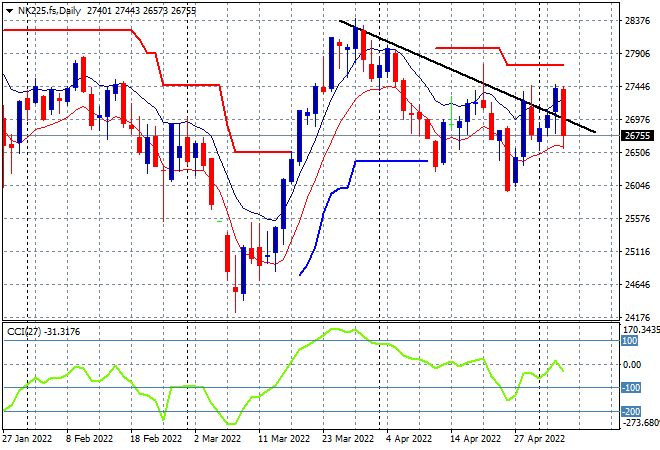
Japanese stock markets were still closed for yet another holiday but will reopen today – what a day to return! The daily futures chart of the Nikkei 225 is showing a decline with a failure to break out above the previous daily highs near the 27500 point level confirming a return to the downward trend from the March highs. Watch for a break below the 26500 level today:
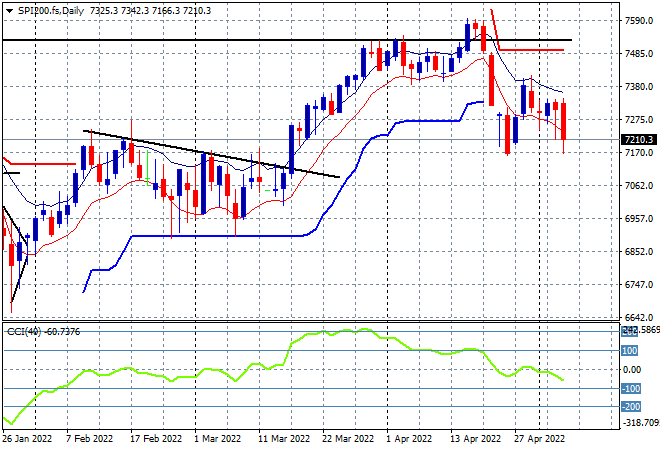
Australian stocks did very well, considering the headwind of a much higher Australian dollar with the ASX200 closing just over 0.8% higher to finish at 7364 points. SPI futures are down over 100 points or over 1.5% so we’re likely to see a bath of blood that could match the previous weekly low below the 7200 points level, wiping out what was strong support at the 7300 point level. I have been saying for awhile we required a swift close above the high moving average at around 7400 points to get out of this funk, but that moment has passed:
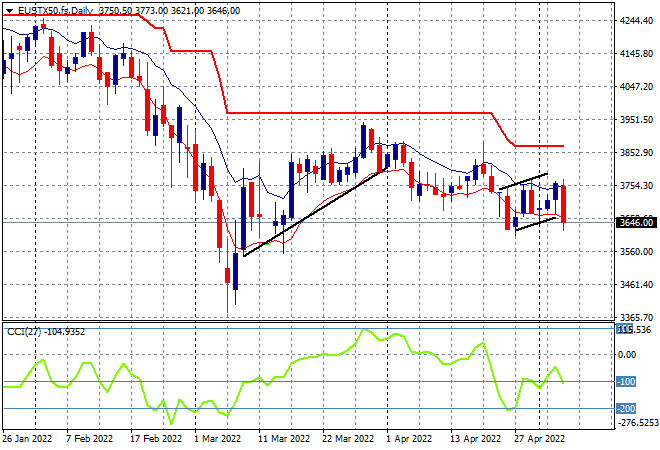
European shares had another poor trading session across the continent with the Eurostoxx 50 index closing nearly 0.8% lower at 3696 points. The daily chart picture still looks quite bearish as futures played catchup following the Wall Street whallopping, with that bottom at the 3600 point level likely to be wiped out despite the long tails of intrasession buying support helping in the last couple of sessions. I don’t think we’ll see a return to any price action around trailing daily ATR resistance at the 3800 level as daily momentum is likely to go very oversold soon:
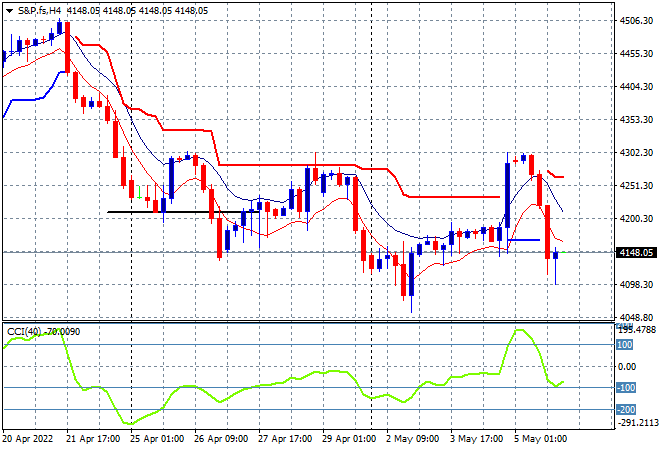
Wall Street has turned the certainty of the rate rise from the Fed into outright panic with all three bourses taking back their previous 3% higher moves with that and more, as the NASDAQ flopped 5% and the S&P500 falling 3.5% to close at 4146 points. Price action on the four hourly chart was possibly building an inverse head and shoulders pattern to set up for a new rally here, but my caution has paid off with a failure to breach last week’s high the telling point. This could get ugly with a return down to 4000 points increasingly likely:
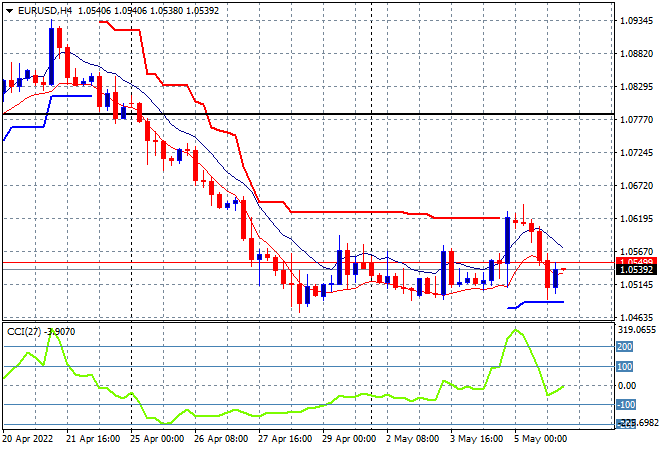
Currency markets have basically just returned to what they were doing before the Fed reversal, with Euro flopping back to its weekly low at the 1.05 handle, alongside every other undollar. Short term momentum has switched back from strongly overbought to negative again as it flops below prior trailing ATR resistance level at the 1.06 handle so watch for any attempt to selloff below the 1.05 level next:
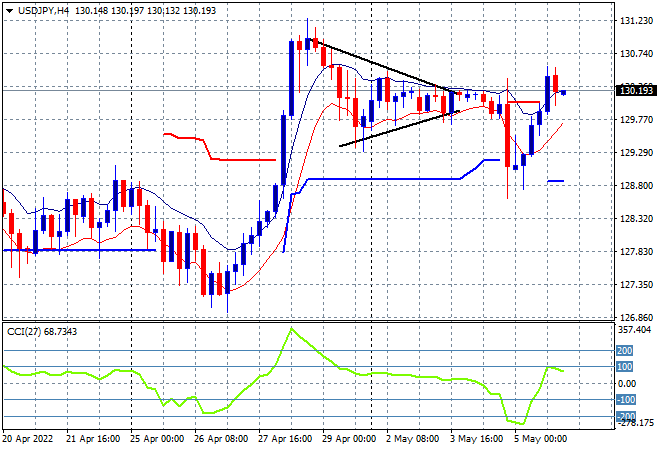
The USDJPY pair also returned to its prior starting point, lifting over 100 pips to get back above the 130 handle this morning, almost making a new weekly high but largely contained with a sideways bullish bias. Four hourly momentum is back to being slightly positive and ready to engage higher as a result:
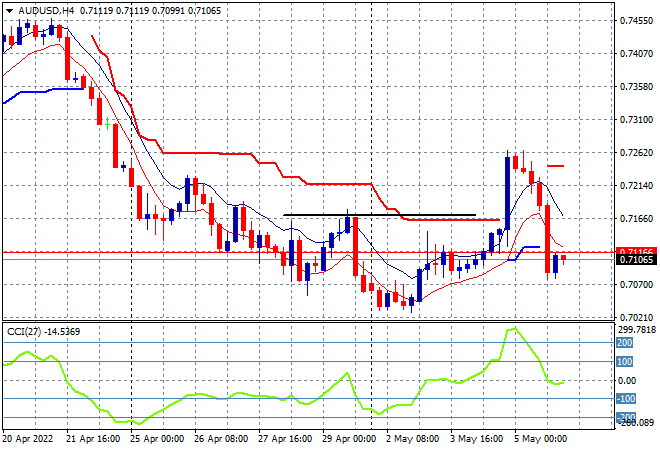
The Australian dollar was one of the most volatile overnight, having squeezed up through the 72 handle previously, it flopped more than 150 pips to return straight down to the 71 handle. Maybe my contention of a rollover back down to the key 70 handle and then into the 60’s still holds, as the potential rollover after the excitement of the Fed rate rise has transpired:
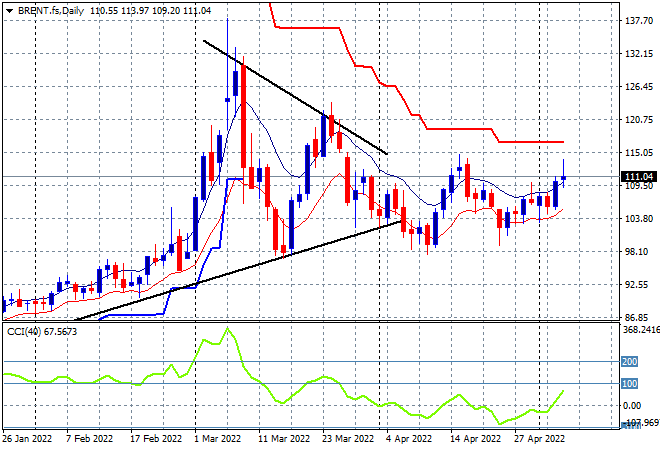
Oil markets had been setting up for another liftoff but the overnight retracement and overall risk volatility is now setting up a potential topping moment, with Brent nearly unchanged at the $111USD per barrel support level. Daily momentum is now positive and just out of the negative zone, but there still remains the possibility of a drawback or breakdown below the key $100 level gaining traction, given no new weekly highs being made for sometime now:
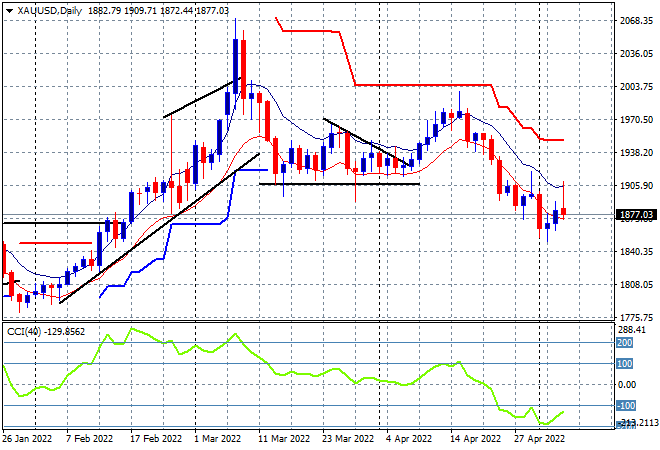
Gold was snared back to reality with a selloff back under the $1900USD per ounce level which has proved itself as strong resistance, finishing at the $1877 level and remaining on a downtrend. Daily momentum hasn’t budged out of oversold territory with the January lows around the $1800 level the next possible downside target:
Glossary of Acronyms and Technical Analysis Terms:
ATR: Average True Range – measures the degree of price volatility averaged over a time period
ATR Support/Resistance: a ratcheting mechanism that follows price below/above a trend, that if breached shows above average volatility
CCI: Commodity Channel Index: a momentum reading that calculates current price away from the statistical mean or “typical” price to indicate overbought (far above the mean) or oversold (far below the mean)
Low/High Moving Average: rolling mean of prices in this case, the low and high for the day/hour which creates a band around the actual price movement
FOMC: Federal Open Market Committee, monthly meeting of Federal Reserve regarding monetary policy (setting interest rates)
DOE: US Department of Energy
Uncle Point: or stop loss point, a level at which you’ve clearly been wrong on your position, so cry uncle and get out!wrong on your position, so cry uncle and get out!