While Sydney’s and Melbourne’s property markets are sliding into the red, Queensland’s continues to rise on the back of strong interstate demand.
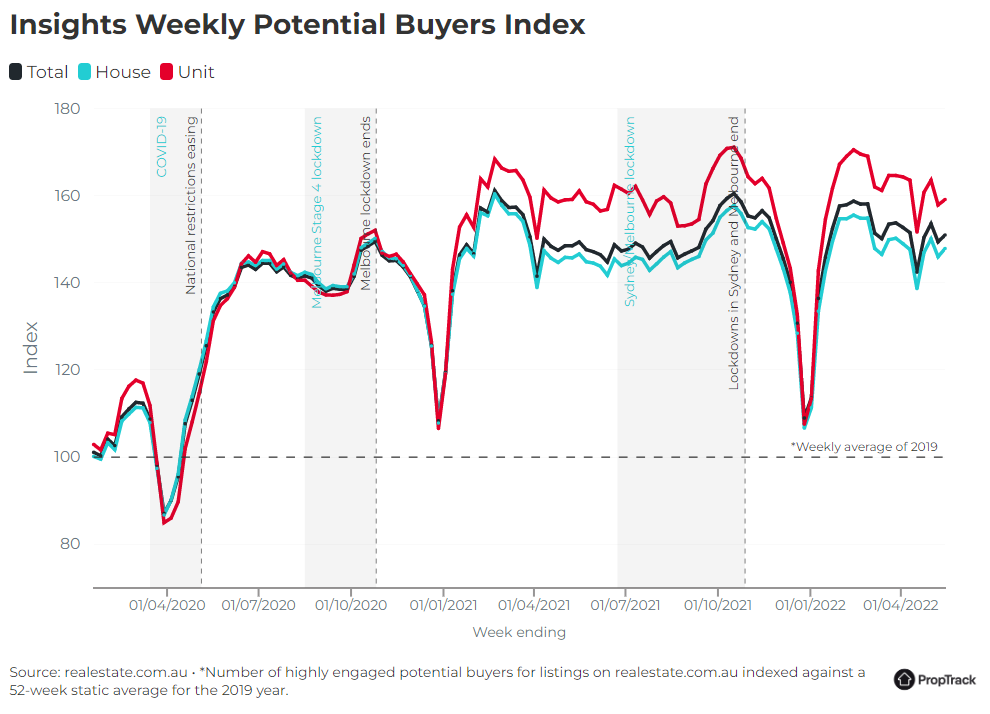
PropTrack’s Potential Buyers Index, which measures the number of people seriously interested in buying, shows that demand nationally has been trending down since March:
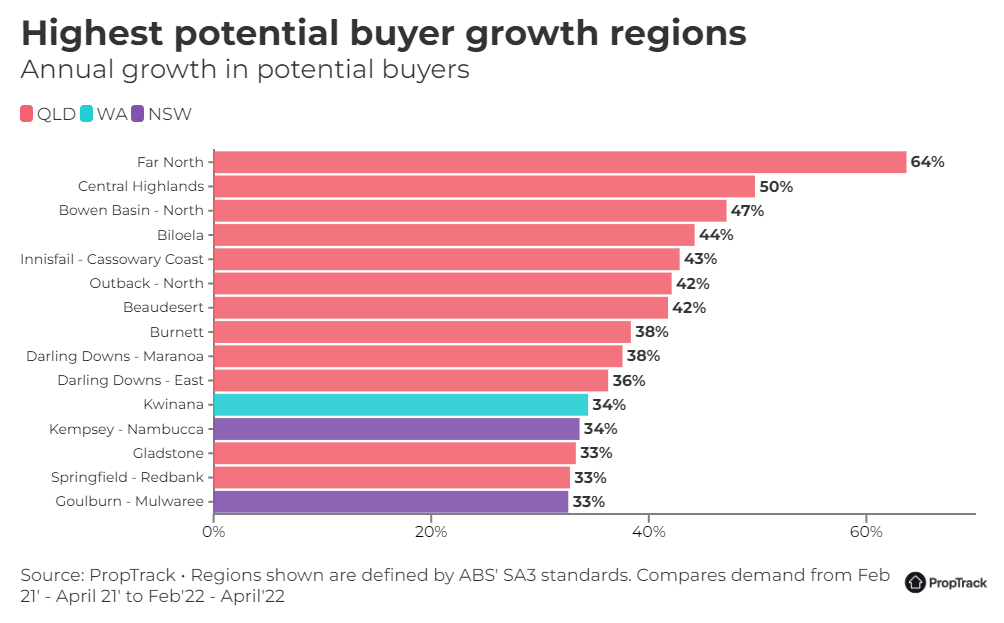
But an analysis of the SA3 regions with the largest annual growth in quarterly potential buyers reveals that interest in Queensland homes skyrocketed over the past 12 months
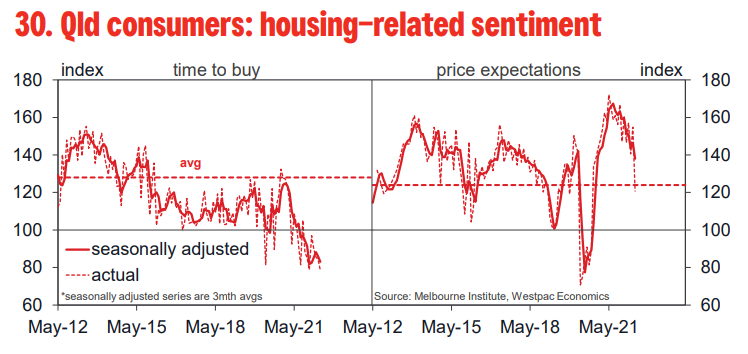
Westpac’s latest Housing Pulse also shows ongoing strong (albeit cooling) demand for Queensland property:
Queensland: from red hot to hot
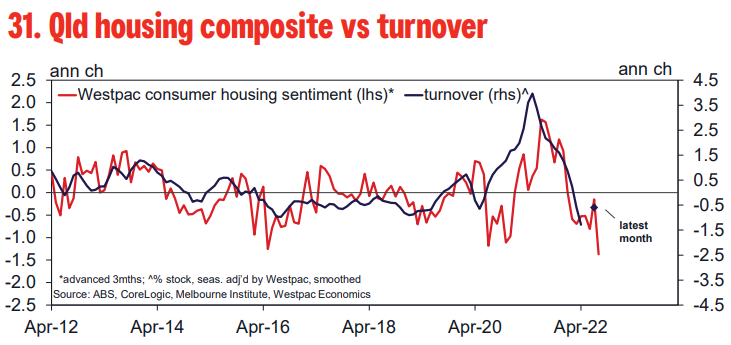
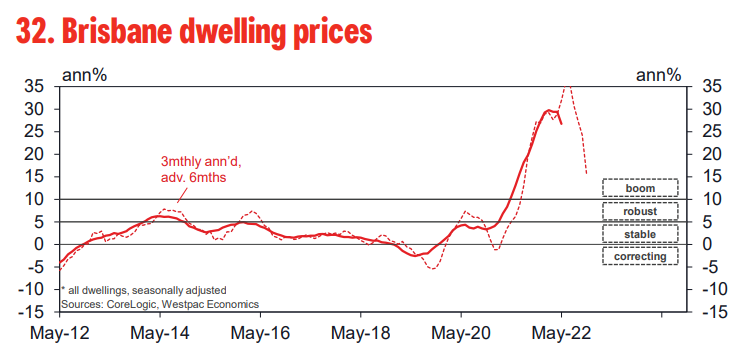
Qld’s housing market is showing signs of cooling after posting a big surge in 2021 that was still driving strong price gains in the first few months of 2022. Turnover has come off but is still high by historical standards. Price momentum has moderated, albeit coming from red hot to just hot with gains still tracking a double–digit annualised growth rate. However, sentiment is showing a clearer turn lower. That said, a super tight supply–demand balance should continue to provide underlying support.
Turnover has declined 20% since the start of the year, but remains high overall, equivalent to over 6% of the total dwelling stock transacting on an annual basis (the other major eastern states are closer to 4–4.5%, the difference partly reflecting lower stamp duties in Qld).
Price momentum has been surprisingly strong year to date, averaging 2%mth from Jan to Apr. However, May is shaping as an abrupt cooling, daily measures pointing to a much more subdued 0.3% gain in the month. Even with this, annual price growth is set to hold at a rollicking 27%yr.
The detail shows a tentative cooling centred on houses and ‘top tier’ properties, which have led the recent gains. Growth momentum has dropped to a single–digit annual pace for Brisbane’s West and inner city but remains stronger for outer suburbs and the Gold and Sunshine Coasts. The regions have seen much milder gains over the latest cycle.
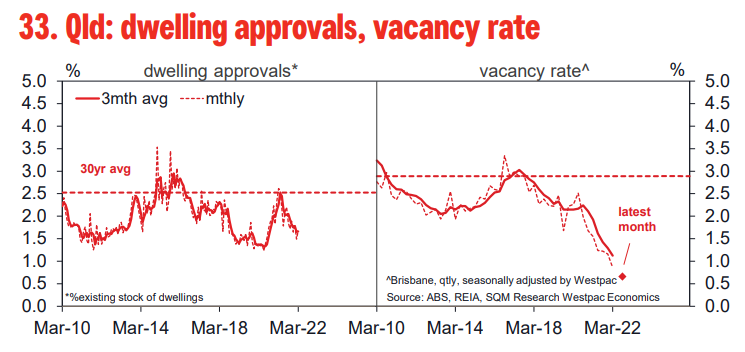
The supply–demand balance remains extremely tight in Brisbane for both houses and units with little sign of reprieve. Indeed, rental vacancy rates point to more pressures, dropping through 1% in Brisbane.
Queensland dwelling values have risen more than 40% over the pandemic. Buyer demand remains strong, but is clearly fading on the back of eroding affordability and rising interest rates.
I give Queensland around six months before prices begin to fall there as well. Soaring interest rates will sink all housing boats.
Leith van Onselen is Chief Economist at the MB Fund and MB Super. He is also Chief Economist and co-founder of MacroBusiness. Leith has previously worked at the Australian Treasury, Victorian Treasury and Goldman Sachs.
Latest posts by Unconventional Economist (see all)
Six months? I see your six months and raise you 18 months™.
JspitzerMEMBER
Qld has less initial reporting of sales, longer settlement time, slower reporting of those settlements meaning prices are 3 months plus behind what’s actually happening.
JspitzerMEMBER
Which is great if you want interest rates to rocket as the RBA will be well behind as usual.
CarlosMEMBER
what is Annual growth in ‘potential’ buyers ?
FNQ 64% ffs.
Potential yeah, after a holiday in July. Reality, not so much after a good, stinking hot wet season.
CC is happening up there too. Less rain, hotter temps.
I'll have anotherMEMBER
It’s been raining here every day for 5 weeks straight, stopped yesterday.
Not arguing on CC but to say it’s been a wet year is an understatement.
CarlosMEMBER
Like i said, a bit lower than usual this yr (Oct to current). Always feels like its been raining forever by May, hence why i’m no longer there, although sunny coast feels the same this yr.
Mean 47 90.4 182.1 402.4 437.8 415.6 201.9 91.2 1868.4
2021/2022 8.2 95.4 117.2 375 127.2 352.6 381.6 172.8 1630.2
2020/2021 same period 2398.6
CarlosMEMBER
and along with that ………temps. The olds have been there 50+ yrs. They know when its changing
Mean Oct to current 31.9 32.6 33.1 32.4 32.5 32 30.5 28.8
Mean all yrs 29.6 30.8 31.5 31.5 31.3 30.6 29.3 27.7
Diff 2.3 1.8 1.6 0.9 1.2 1.4 1.2 1.1
I'll have anotherMEMBER
Thanks Carlos, love a good bit of weather data.
Yeah it’s for sure getting hotter up here in the nth and it’s hard on the health during summer.
BradleyMEMBER
If the floods, humidity or congestion doesn’t do their heads in, new arrivals will find the mould will.
I'll have anotherMEMBER
Floods are a NSW problem too. In fact the South of Sydney will flood nearly yearly besides the obvious issues in the north of NSW. Congestion and floods are only really in the sth east corner and it’s heaps less congested than Sydney or Melbourne. Humidity is a thing, can’t deny that.
AaronMEMBER
Needs a LEMMINGS index.
Loads of
Excess
Money
Moving
Interstate
Not
Going to
Survive
ZAMEMBER
Love it….
aleks
EFF OFF we are full.
ZAMEMBER
Oh no… Not more crap… I doubt any of them will create any wealth or new jobs for local people already there.
haroldusMEMBER
I do hope you’re getting some v!brancy with those numbers.
Six months? I see your six months and raise you 18 months™.
Qld has less initial reporting of sales, longer settlement time, slower reporting of those settlements meaning prices are 3 months plus behind what’s actually happening.
Which is great if you want interest rates to rocket as the RBA will be well behind as usual.
what is Annual growth in ‘potential’ buyers ?
FNQ 64% ffs.
Potential yeah, after a holiday in July. Reality, not so much after a good, stinking hot wet season.
CC is happening up there too. Less rain, hotter temps.
It’s been raining here every day for 5 weeks straight, stopped yesterday.
Not arguing on CC but to say it’s been a wet year is an understatement.
Like i said, a bit lower than usual this yr (Oct to current). Always feels like its been raining forever by May, hence why i’m no longer there, although sunny coast feels the same this yr.
Mean 47 90.4 182.1 402.4 437.8 415.6 201.9 91.2 1868.4
2021/2022 8.2 95.4 117.2 375 127.2 352.6 381.6 172.8 1630.2
2020/2021 same period 2398.6
and along with that ………temps. The olds have been there 50+ yrs. They know when its changing
Mean Oct to current 31.9 32.6 33.1 32.4 32.5 32 30.5 28.8
Mean all yrs 29.6 30.8 31.5 31.5 31.3 30.6 29.3 27.7
Diff 2.3 1.8 1.6 0.9 1.2 1.4 1.2 1.1
Thanks Carlos, love a good bit of weather data.
Yeah it’s for sure getting hotter up here in the nth and it’s hard on the health during summer.
If the floods, humidity or congestion doesn’t do their heads in, new arrivals will find the mould will.
Floods are a NSW problem too. In fact the South of Sydney will flood nearly yearly besides the obvious issues in the north of NSW. Congestion and floods are only really in the sth east corner and it’s heaps less congested than Sydney or Melbourne. Humidity is a thing, can’t deny that.
Needs a LEMMINGS index.
Loads of
Excess
Money
Moving
Interstate
Not
Going to
Survive
Love it….
EFF OFF we are full.
Oh no… Not more crap… I doubt any of them will create any wealth or new jobs for local people already there.
I do hope you’re getting some v!brancy with those numbers.