
More hawkish signals from the Fed overnight on the release of the latest FOMC minutes saw risk sentiment sour yet again with European markets falling sharply as the weight of more Russian sanctions has seen the bear market rally falter. The USD rose against most of the major currency pairs again, with the USD Index at a two year high with the Australian dollar slumping post the RBA meeting euphoria. Interest rate and bond markets are still confirming many more rate rises on the way, with the 10 year Treasury range pulling back slightly from the 2.6% yield level. Commodities were generally off across the board with both WTI and Brent crude losing 4%, the former dropping below the $100USD per barrel level while the latter barely finished above. Gold was largely unchanged around the $1920USD per ounce level.
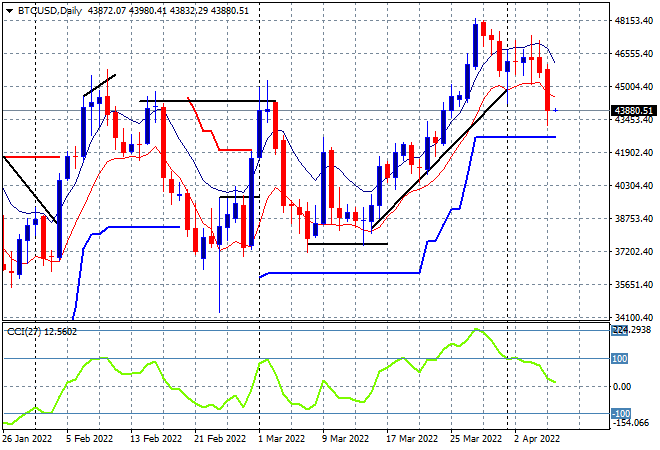
Bitcoin finally made a move overnight and it was all downhill, falling through nascent support at the $45K level as it failed to make a new daily high in recent sessions as momentum inverted. While only a oneoff with daily ATR support still intact at the $43K level, this takes it back to former resistance, now support at the January and February highs:
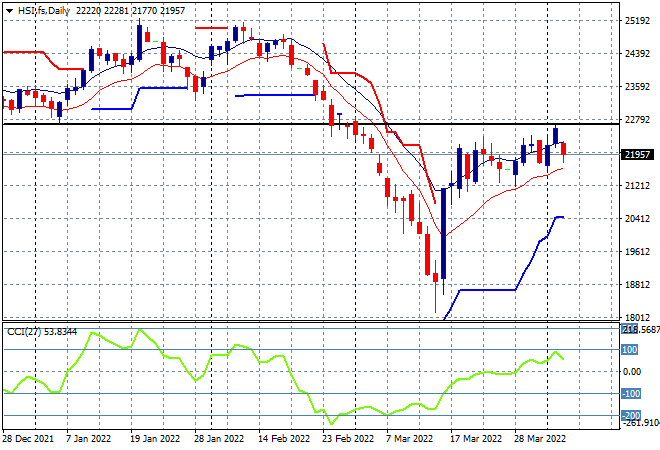
Looking at share markets in Asia from yesterday’s session, where mainland Chinese share markets reopened after a long weekend holiday with the Shanghai Composite falling 0.2% to 3276 points while the Hang Seng Index lost almost 2% to 22080 points. The daily chart of the Hang Seng Index was indicating a potential breakout having been supported at the 21200 level but the attempt to clear very strong resistance at the 22600 point level next is faltering here as momentum wanes. Watch the low moving average to break like in other markets with similar structures:
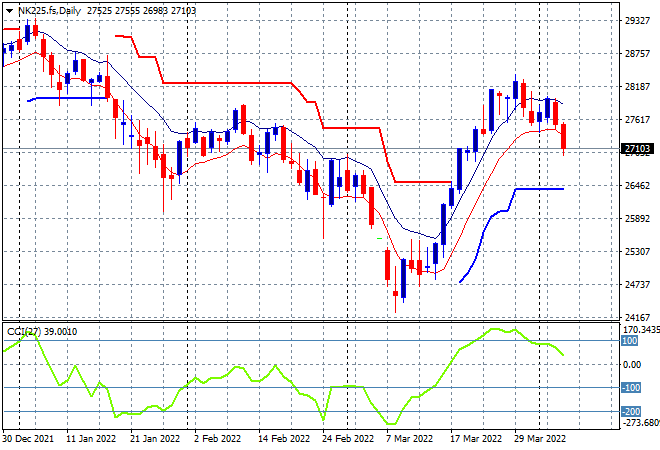
Japanese stock markets switched into reverse mode as well with the Nikkei 225 falling over 1.5% to 27350 points. Futures are indicating more downside on the open despite a weaker Yen as daily momentum reverts sharply from its slightly overbought status. I mentioned last week that price action looks toppy, as it reverts back to weekly resistance at the 27500 point level and may begin to fall below the previous February highs, with that low moving average now broken through with all the signs of a breakdown:
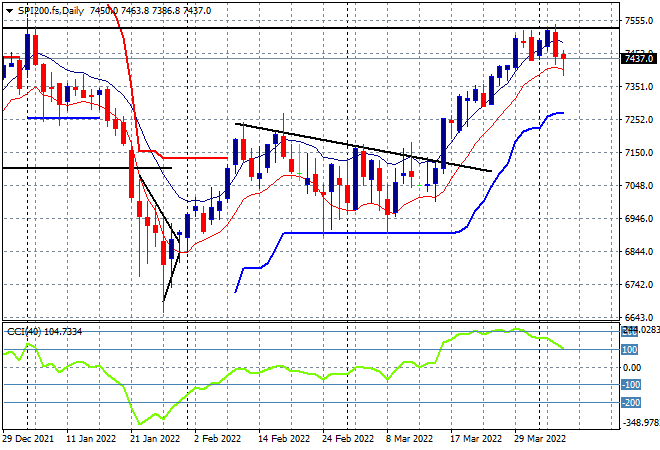
Australian stocks were the best relative performers with the ASX200 closing 0.5% lower, falling below the 7500 point level to close at 7490 points. SPI futures are down more than 50 points or despite the lower Australian dollar providing a buffer. The daily chart was showing a lot of potential with daily momentum still quite strong but price is finding stiff resistance at the former highs from December last year – watch for a rollover through the low moving average today:
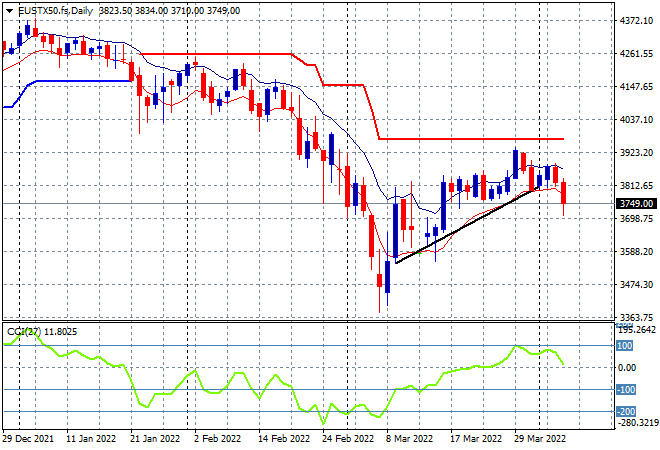
European shares had wide selloffs with more sanction fears now turning into risk aversion as the Eurostoxx 50 index slumped 2.3% lower at 3824 points taking back all its previous gains. Price was firming here at the 3800 point zone with building indications of breakout potential but as I said previously, momentum is key and required a proper overbought reading and now we have capitulation below the trendline and the low moving average:
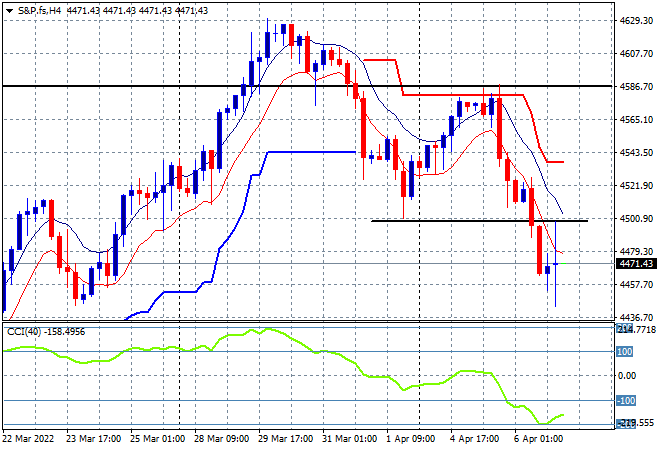
Wall Street had a similar result but spread out in relative terms with the Dow losing only 0.4% while the NASDAQ again fell more than 2% while the S&P500 took the middle road and lost nearly 1%, closing at 4481 points. Price action on the four hourly chart now shows a break below previous support at the 4500 point level with momentum well oversold as a result. There may be a silver lining here with price action in the final session indicating the BTFD crowd is stepping in to stave off a new monthly low:
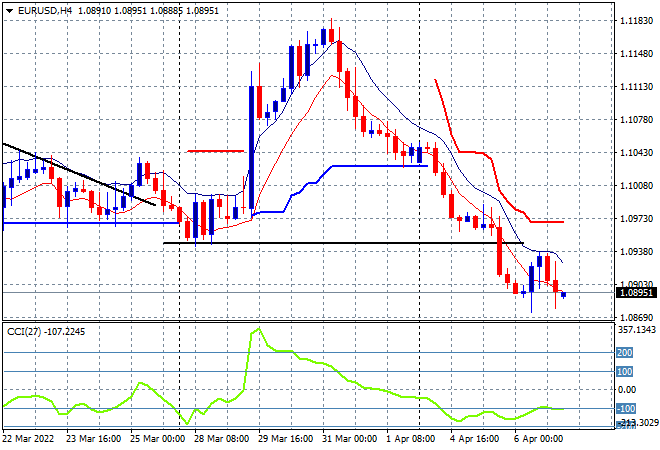
Currency markets continued to see a much stronger USD as a result of the FOMC minutes and the sanctions bugaboo for Europe with Euro remaining well below the previous weekly support level and pushing below the 1.09 handle proper. Having completely wiped out the previous price surge, this short term price move is keeping it line with its longer term downtrend – watch for another breakdown shortly:
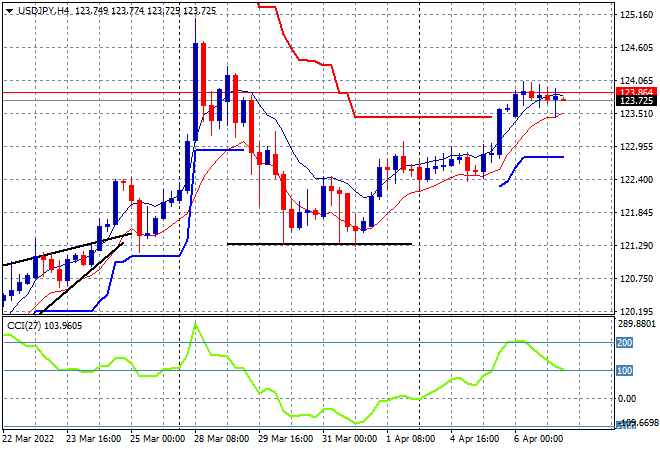
The USDJPY pair consolidating again after its previous big breakout, stabilising well above the 123 handle overnight. This sees price action clearing trailing ATR overhead resistance with the slight possibility of heading back to the previous high from late March. I’m wary of more upside potential here – watch the low moving average to possibly come under threat:
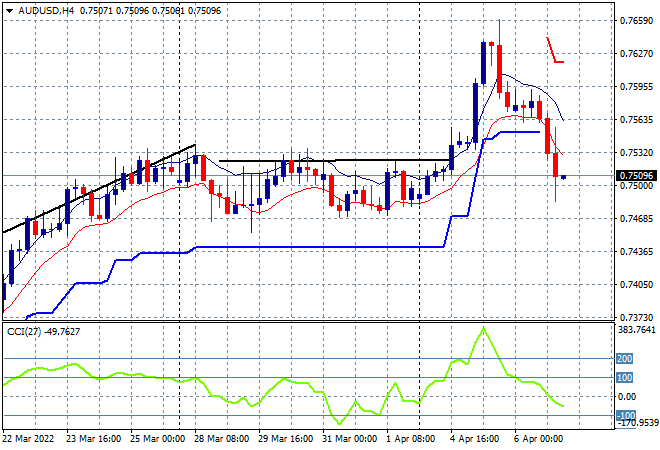
The Australian dollar has pulled back sharply from its post RBA euphoria, dropping below the 75 handle in the process where it finds itself this morning, well below previous resistance that had acted as support in the prior move. As I said yesterday, I contended this drop would be shortlived with more upside potential building as commodity prices are likely to rebound in the wake of more Russian sanctions, with Australian exports the big winner, but price is telling another story here so far:
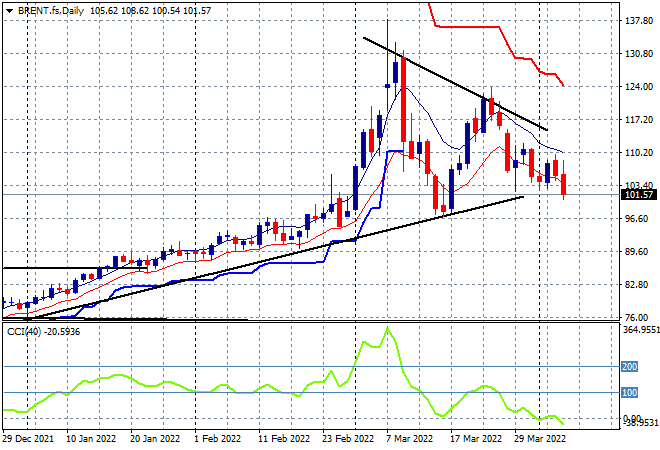
Oil markets are moving from consolidation to selling off following the post invasion Ukrainian highs as part of a multi week structure with Brent crude retracing nearly 4% overnight to the $101USD per barrel level with support at the $103 level now broken. As I’ve contended for a while now, the charts of oil leading up to and through this conflict are classic technical bubbles with the second peak lower than the first. This provide a potential continuation move here to flop down to the $100 level as daily momentum reverts back into negative readings:
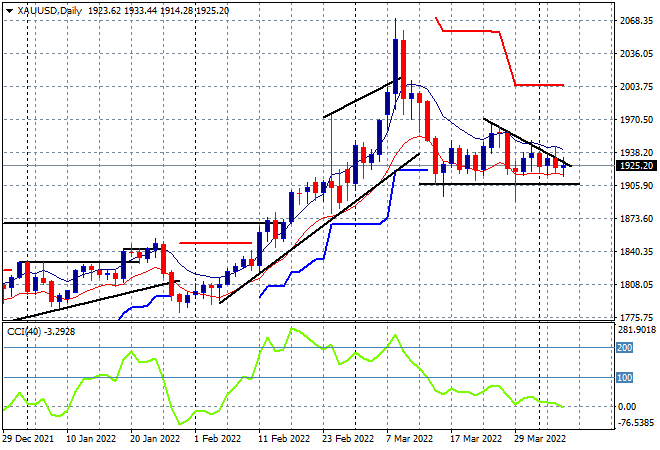
Gold again did nothing last night to finish flat at the $1923USD per ounce level. Price is coming up against the downtrend from the mid March highs with momentum still basically neutral, with a close above the high moving average at the $1930 area required soon or this will rollover swiftly:
Glossary of Acronyms and Technical Analysis Terms:
ATR: Average True Range – measures the degree of price volatility averaged over a time period
ATR Support/Resistance: a ratcheting mechanism that follows price below/above a trend, that if breached shows above average volatility
CCI: Commodity Channel Index: a momentum reading that calculates current price away from the statistical mean or “typical” price to indicate overbought (far above the mean) or oversold (far below the mean)
Low/High Moving Average: rolling mean of prices in this case, the low and high for the day/hour which creates a band around the actual price movement
FOMC: Federal Open Market Committee, monthly meeting of Federal Reserve regarding monetary policy (setting interest rates)
DOE: US Department of Energy
Uncle Point: or stop loss point, a level at which you’ve clearly been wrong on your position, so cry uncle and get out!wrong on your position, so cry uncle and get out!