

Despite a very strong US jobs report on Friday night, risk markets are still focused squarely on the Russian invasion of Ukraine with European shares crashing again, down nearly 5% while Wall Street put in a stumbling effort as the race to safe havens included USD. Bond yields pulled back sharply, with the 10 year Treasury heading down to the 1.7% level on the back of the NFP print, with markets only fully pricing in a 25bps rise this month from the Fed. Currency markets saw a big move towards USD that was mainly huge Euro weakness as commodity currencies like the Aussie dollar had very solid sessions and Yen safe haven buying accelerated. Commodity markets are being dominated by limit up sessions – particularly agriculuturals – but Brent again almost hit the $120USD per barrel level while copper rose nearly 6% and gold lifted nearly 2% making its way to the $2000USD per ounce level.
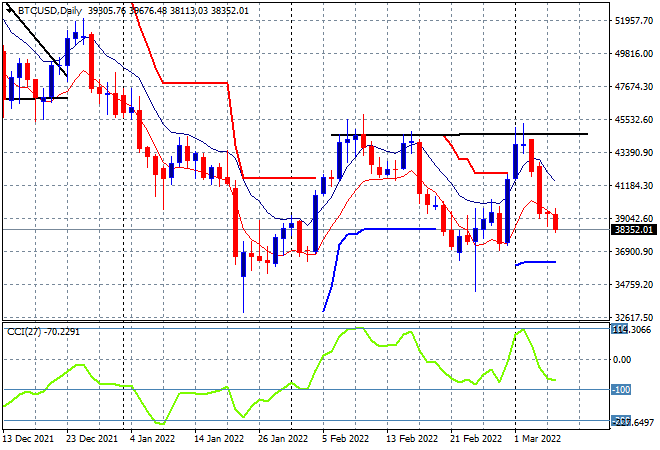
Bitcoin hit the wall mid last week, unable to push above the former weekly high at the $44K level despite an influx of desperate Russian buyers. The daily chart shows this quite plainly with a rejection now sending the crypto currency back down towards its previous monthly lows nearer the $36K level:
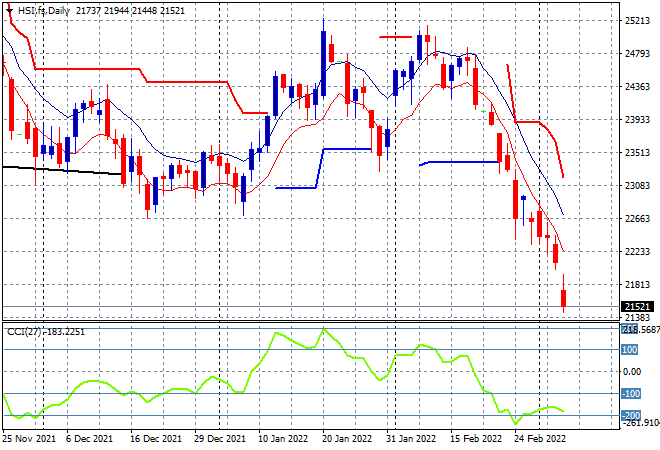
Looking at share markets in Asia from Fridays’s session, where mainland Chinese shares pulled back into the close with the Shanghai Composite closing down 0.9% to 3447 points while the Hang Seng Index slumped 2.5% to fall to 21905 points. Price action on the daily chart is grim indeed, with the 2020 lows taken out and the growing possibility of more downside, as monthly support at the 22600 point level also evaporates. Daily and weekly momentum are both very oversold as this correction gathers apace:
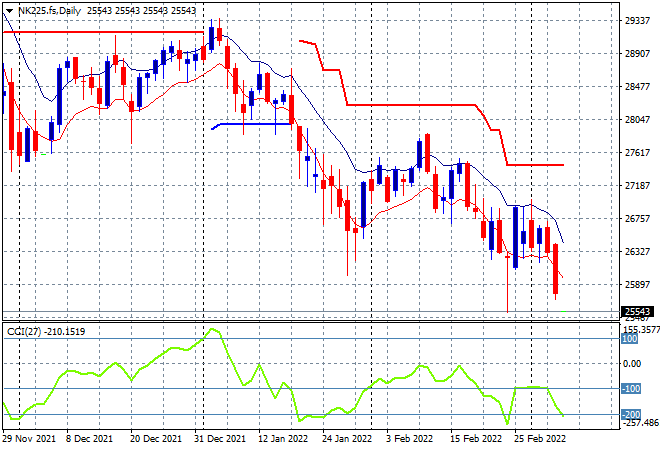
Japanese stock markets also sold off sharply with the Nikkei 225 down more than 2.2% to 25985 points. Futures are suggesting even more downside on the open given that Yen has soared in appreciation and European stocks crash lower. Price action is no longer contained with the daily chart now suggesting a proper correction is underway, with the January lows taken out and then some:
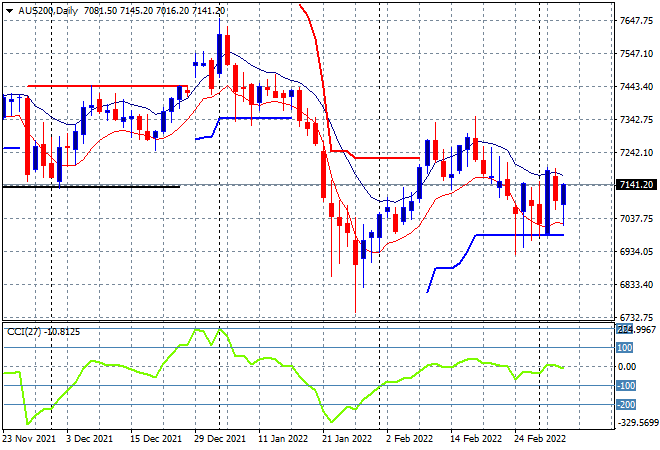
Australian stocks were the best performers in the region, relatively speaking ,with the ASX200 managing to close the week out above the 7100 point level, finishing only 0.5% lower at 7111 points. SPI futures are up 0.4% despite the big volatility in European markets, so we’re likely to start the week holding above the 7100 point level which has proven as solid short term support. As I’ve been saying for awhile now, there is still considerable resistance overhead at the previous weekly/monthly support levels so watch daily momentum that needs to get back into the positive zone soon before considering any long opportunities:
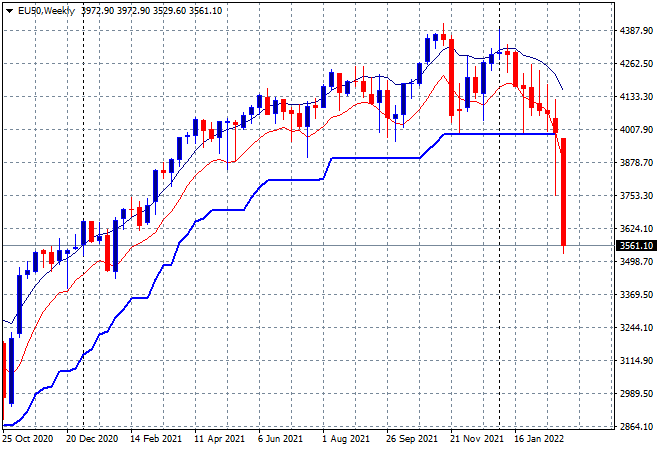
European shares crashed, there’s no other way to describe it with the Eurostoxx 50 index slumping nearly 5%, wiping out all of the meagre recent gains and then some to finish at 3556 points, with the weekly chart showing how bad last’s weeks price action really was as all of 2021’s gains are wiped out. This is a near freefall and could go further below as this conflict continues, with the potential to correct down to the former 3300 point level that stood as support midway through 2020:
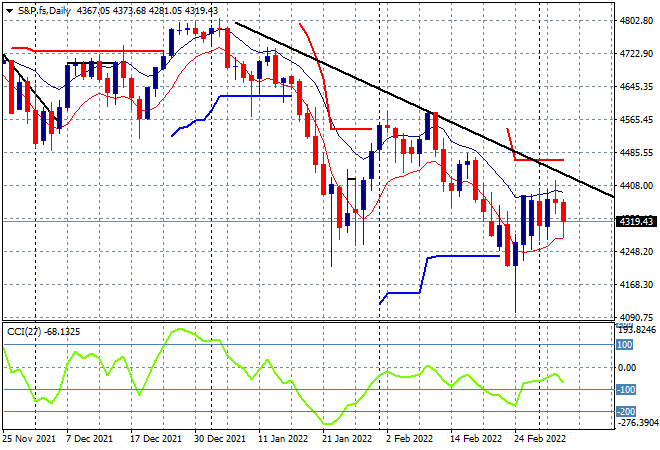
Wall Street also slumped as the non-farm payrolls came in, with tech stocks leading the charge, the NASDAQ losing more than 1.6% while the S&P500 stumbled to finish 0.7% lower at 4328 points. The daily chart is looking poised here with a downtrend clearly in place but not in full correction mode – yet. Watch for any breach below the low moving average at the 4250 point level that must hold in the coming days:
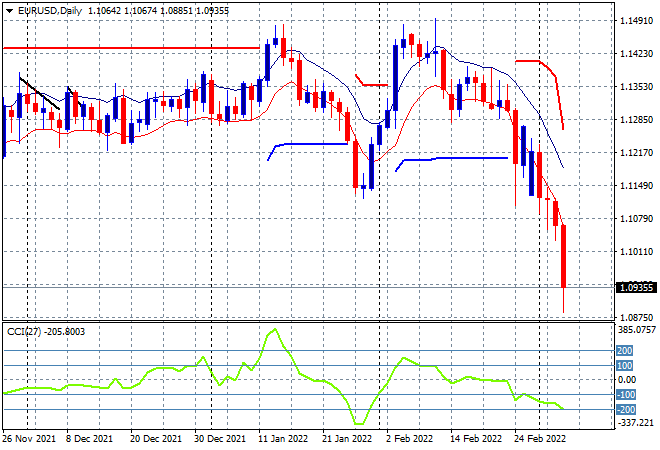
Currency markets are in upheaval yet again with mammoth runs to safe havens which is leading to a big implosion in Euro as it breaks below the 1.10 handle, having lost more than 500 pips in two weeks. The daily chart shows the decline since the Russian invasion, with Friday night seeing it accelerate to become extremely oversold, so normally we should expect a small bounceback here, but anything can happen due to macro events:
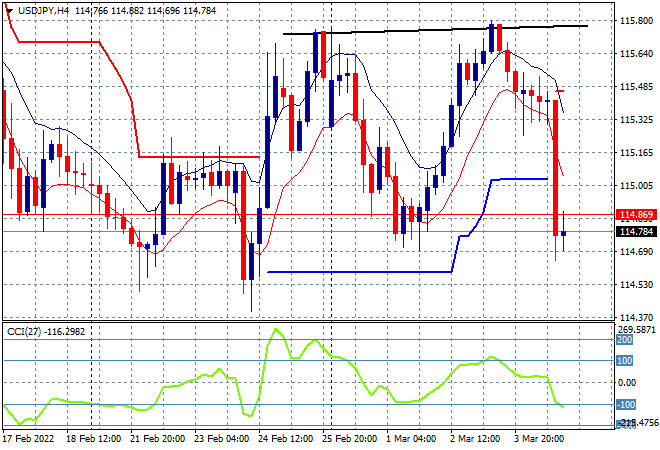
The USDJPY pair also slumped, basically making the USD index unchanged as Yen safe haven buying accelerated despite the very strong NFP print on Friday night, sending the pair back to the mid 114 level and the recent weekly lows. Despite this fall, the medium term trend has no discernible direction, having range traded for sometime now but watch for any break below weakly support at the 114.50 level:
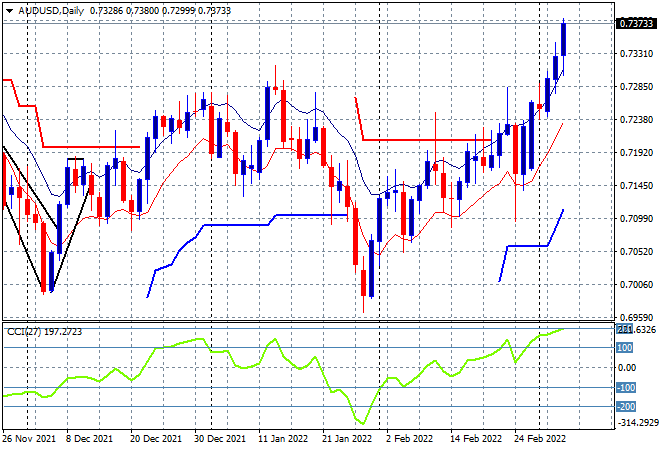
The Australian dollar remains on a tear, pushing up towards the 74 handle on Friday night to build on its breakout above the previous week’s intrasession high. Volatility continues to reign here as commodity prices go nuts, with this move above the 73 handle part of a multi week breakout pattern, with momentum nicely placed here to keep things moving higher:
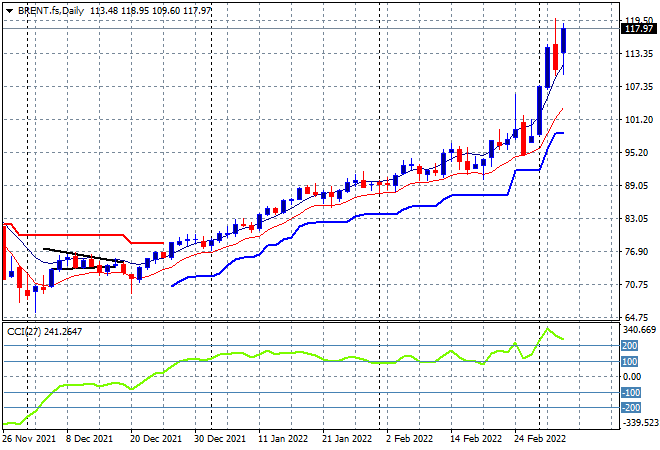
Oil markets continue to look very toppy indeed with another breakout towards the $120USD per barrel level on Friday night confirming the upside potential of Brent crude, even though the trend gets WAY overextended. However, wars have a way of turning technical pictures upside down and that’s what we’re seeing here so be cautious and watch that low moving average on the daily chart that continues to provide a good uncle point, as the $100USD level may become strong support going forward:
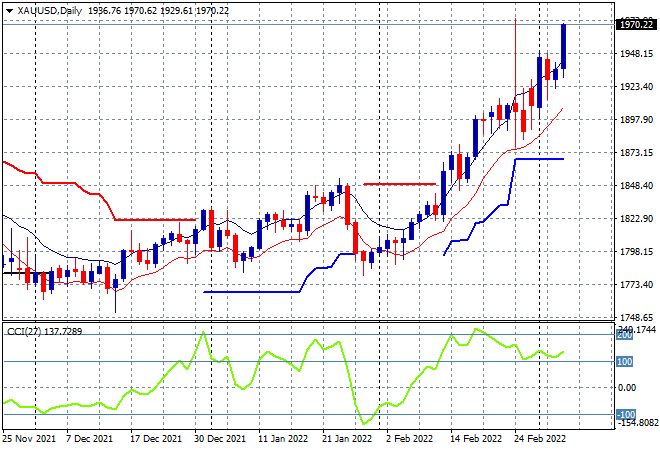
Gold had another sold ride on Friday despite the very strong NFP print, finishing at the $1970USD per ounce level with the trend up to the $2000USD per ounce level still intact. Daily momentum remains nicely overbought and price action is contained nicely at the upper end of the moving average band but watch for any overshoots below the low moving average as a potential topping sign:
Glossary of Acronyms and Technical Analysis Terms:
ATR: Average True Range – measures the degree of price volatility averaged over a time period
ATR Support/Resistance: a ratcheting mechanism that follows price below/above a trend, that if breached shows above average volatility
CCI: Commodity Channel Index: a momentum reading that calculates current price away from the statistical mean or “typical” price to indicate overbought (far above the mean) or oversold (far below the mean)
Low/High Moving Average: rolling mean of prices in this case, the low and high for the day/hour which creates a band around the actual price movement
FOMC: Federal Open Market Committee, monthly meeting of Federal Reserve regarding monetary policy (setting interest rates)
DOE: US Department of Energy
Uncle Point: or stop loss point, a level at which you’ve clearly been wrong on your position, so cry uncle and get out!wrong on your position, so cry uncle and get out!