

Stock markets bounced considerably on Friday night, taking back the previous huge losses in one swift stroke as optimism around sanctions on Russia and united effort against the Ukrainian invasion took hold. European stocks gained around 4% while Wall Street finished more than 2% higher, almost taking both bourses back to their start of week positions, but still needing more upside to fill in all of the recent losses. Volatility on currency markets remains high with a selloff in safe havens like Yen, USD and gold seeing all three pullback while commodity currencies were mixed due to a selloff on oil. Its going to be a very interesting trading week!
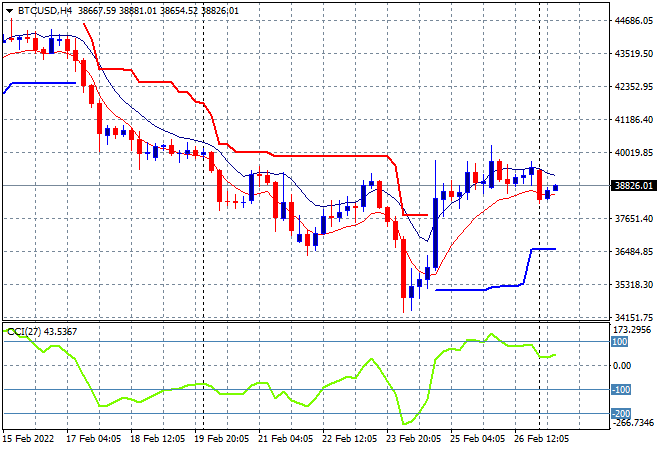
Bitcoin stabilised and went nowhere on Friday and over the weekend, consolidating here just below the $39K level after briefly getting above the $40K level during the week, failing to make a new weekly high. The four hourly chart shows price poised here below the previous ATR resistance level so watch for any action above the key $40K level next:
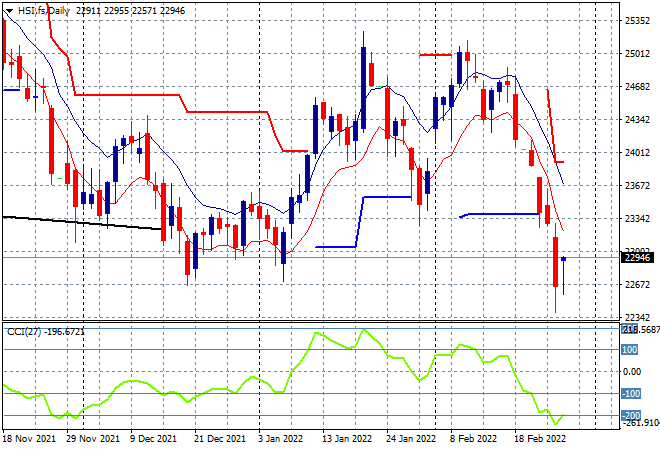
Looking at share markets in Asia from Friday’s session, where mainland Chinese shares are in comeback mode with the Shanghai Composite up nearly 0.7% to 3452 points while the Hang Seng Index moving the other way, finishing 0.6% lower at 22767 points.Price action on the daily chart shows how this massive retracement has crushed through the previous support level at 24000 points and then monthly support at the 22600 point level. But we could see a quick bounceback on short covering here in response to moves on Wall Street and Europe as volatility remains very high:
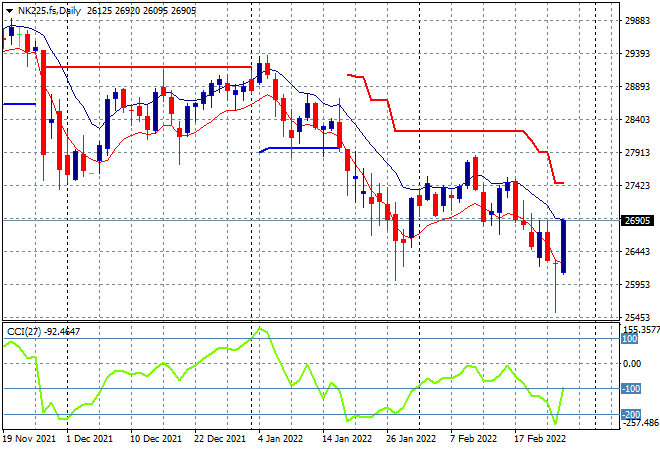
Japanese stock markets had a great surge as well, with the Nikkei 225 lifting 1.9% to 26479 points as Yen safe haven buying abated but some of this could be clawed back in the final session of the week with futures suggesting a pull back to the 26000 point level. The daily chart is not looking good but in the short term, futures and a much lower Yen should provide a tailwind for more upside, possibly through the 27000 point level this week. Although price remains anchored here at or below the January lows:
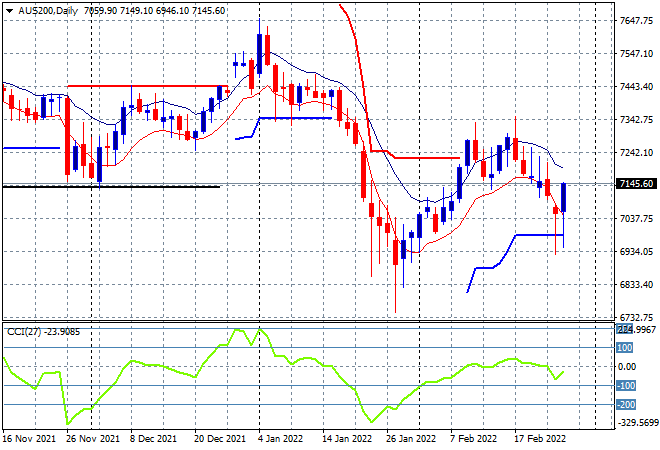
Australian stocks finished higher but only just with tech stocks leading the bounce but mining – particularly gold – pulling back with the ASX200 closing 0.1% higher at 6997 points. SPI futures are up at least 2% in a big rebound on the bounceback on Wall Street, while the daily chart remains fragile with considerable resistance still overhead at the previous weekly/monthly support levels watch daily momentum to get back into the positive zone soon:
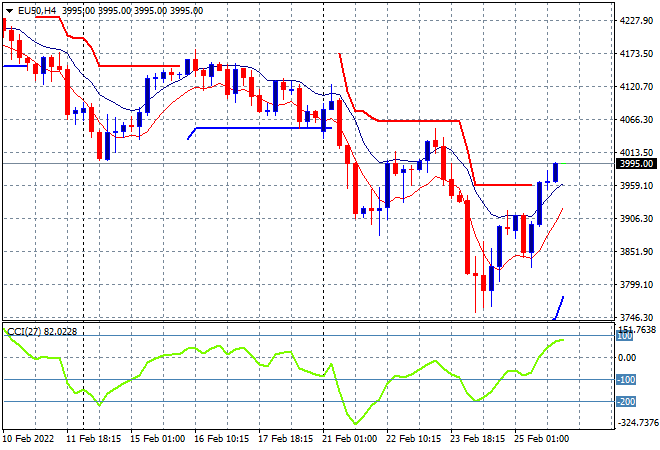
European shares had another wild session session, this time to the upside with the Eurostoxx 50 index eventually finishing more than 3.6% higher at 3970 points, with the daily futures chart showing an almost complete recovery to the start of week position. This still keeps price just below the former weekly ATR support at the 4000 point level but we could be seeing a successful “buy the invasion/sell the news” trade working here:
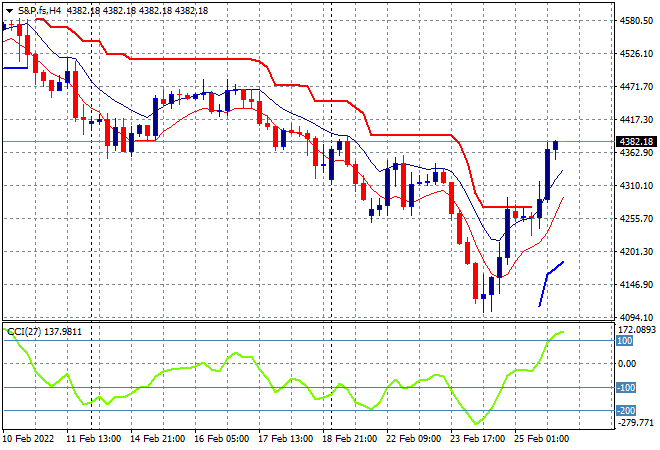
Wall Street also bounced back but not as high, still putting in very strong moves with the NASDAQ gaining 1.6% while the S&P500 did even better, finishing 2.2% higher at 4384 points. The four hourly chart shows how price is now back to the start of week correction point, still not clear of the key 4400 psychological point level but close enough to get the risk spirits moving:
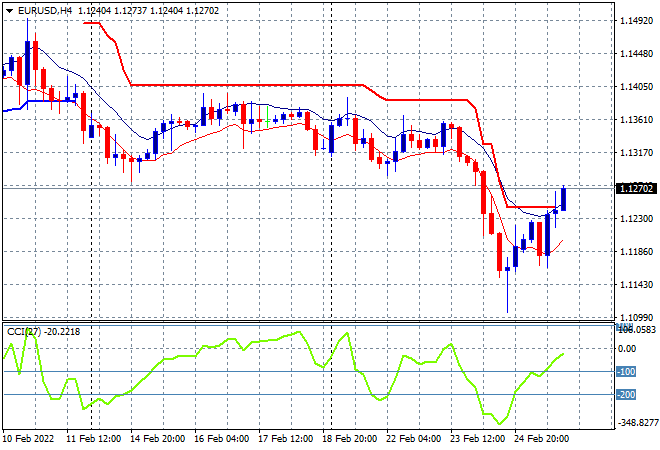
Currency markets remained volatile with the USD index losing ground as Euro bounced off its two year low to almost cross above the 1.13 handle but it was way off its start of week position for this to be considered anything but a swing play. While four hourly ATR resistance has been cleared there’s a long way to go here for normalisation with momentum still not yet positive:
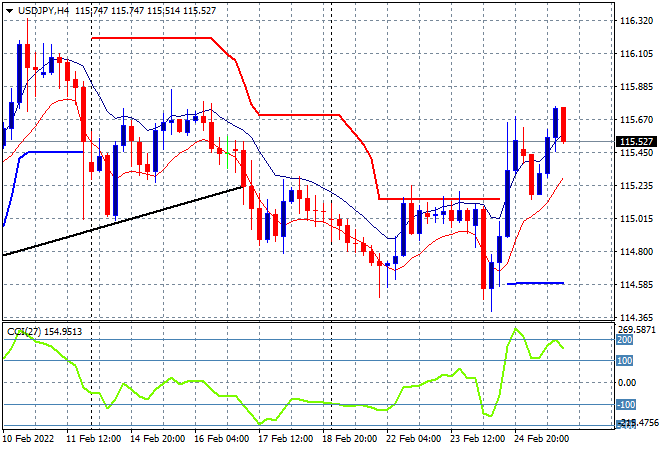
The USDJPY pair had another go at getting past the 115 level into a new rally point but in the end failed to beat the previous weekly high just above the 115 mid level even as Yen safe haven buying slowed down. Four hourly momentum was extremely overbought and remains nicely over the expansion line coming into the new trading week but I’m watching the low moving average on the four hourly chart for signs on another reversal here:
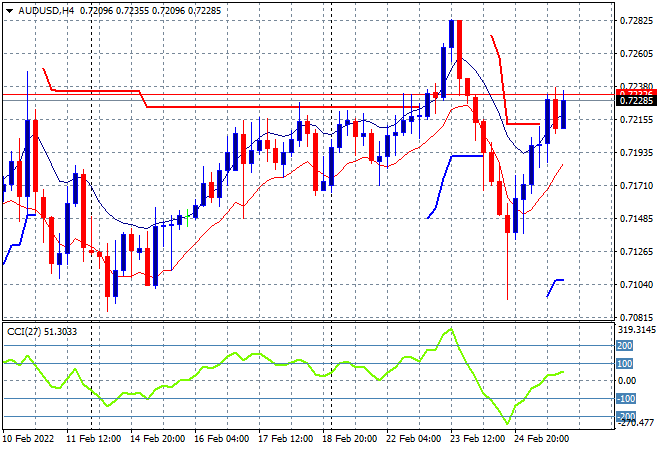
The Australian dollar continued its mid week epic bounceback with volatility still ruling the roost here, with a move just back above the 72 handle after nearly moving 400 pips intraweek. I still contend this move maybe shortlived with any further falls in commodity prices on extremely overbought price action likely to result in a swift fallback for the Aussie so watch for a potential retracement below the low moving average on the four hourly chart here:
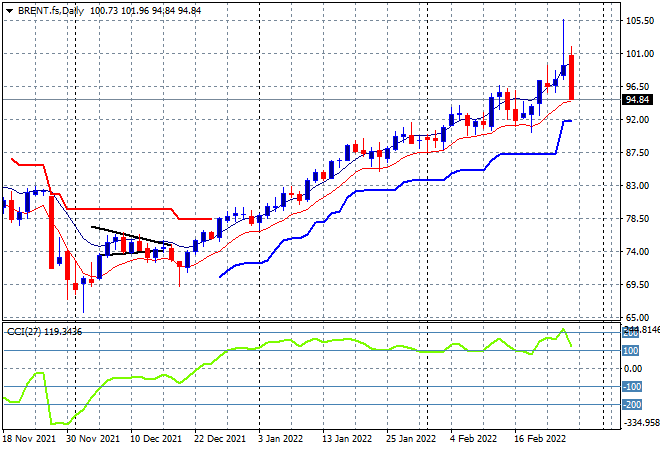
Speaking of retracements, oil markets had big pullbacks on Friday night on profit taking as the financial embroglio deepened for the Russians, as Brent crude fell back below the $95USD per barrel level after recently spiking well above the key $100USD per barrel. I had warned of volatility rising here with profit taking to come next, and here we are, so be wary of another pullback below the daily low moving average line or trailing ATR support that has held since breaking out post Xmas:
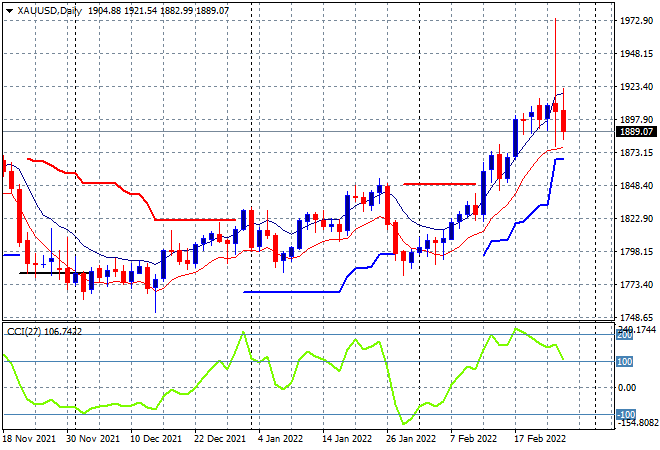
Gold continues to have a wild ride with its massive surge towards the $2000USD per ounce level now put in its place with the Friday night session seeing the shiny metal finish at the $1890 level -This is a little short of my target in any possible retracement back, somewhere near the $1870 level, but there maybe stability from here on in with another rise back above $1900 on consolidation:
Glossary of Acronyms and Technical Analysis Terms:
ATR: Average True Range – measures the degree of price volatility averaged over a time period
ATR Support/Resistance: a ratcheting mechanism that follows price below/above a trend, that if breached shows above average volatility
CCI: Commodity Channel Index: a momentum reading that calculates current price away from the statistical mean or “typical” price to indicate overbought (far above the mean) or oversold (far below the mean)
Low/High Moving Average: rolling mean of prices in this case, the low and high for the day/hour which creates a band around the actual price movement
FOMC: Federal Open Market Committee, monthly meeting of Federal Reserve regarding monetary policy (setting interest rates)
DOE: US Department of Energy
Uncle Point: or stop loss point, a level at which you’ve clearly been wrong on your position, so cry uncle and get out!wrong on your position, so cry uncle and get out!