

Right. Well that was a fun night unless you live somewhere near the Dnieper River, with risk markets going absolutely epic over the Russian invasion of Ukraine with European stocks losing mroe than 5% at one stage while Wall Street slumped 3%, all before a big BTFD rally saw the latter finish 1-3% higher! The volatility on currency markets was equally matched with massive round trips in Euro, which made a two year low at one stage and of course the Australian dollar as commodity markets also tripped limit up/down settings across the globe. US bond markets saw a similar move with yields with the 10 year Treasury falling sharply to the 1.85% level before rising again up towards the 2% level. Brent crude oil exceeded $105USD per barrel at one stage before settling just below the century level, while gold almost hit the $2000USD per ounce level before also retracing sharply to finish at $1900 or so.
I need some coffee before going on…
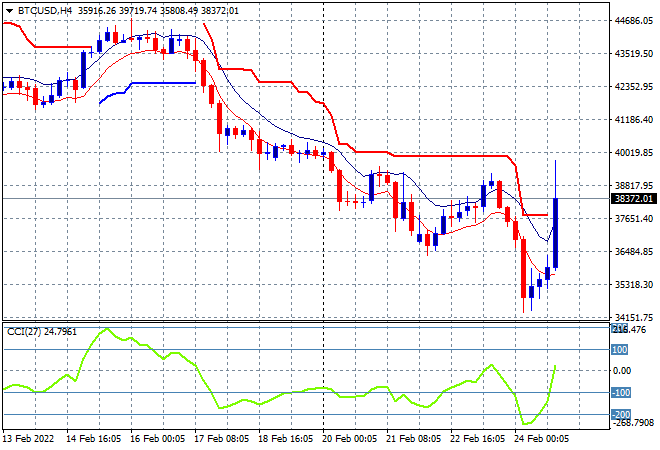
Bitcoin first which had slumped in the Asian session as the invasion got underway and then zoomed higher to almost breach the $40K level before settling just above $38K level this morning. The four hourly chart how big this bounce has been in the last 24 hours but can it be sustained and get back above that key $40K level next?
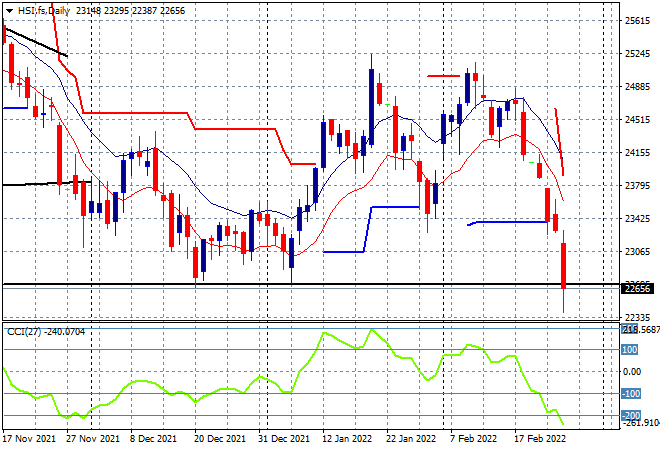
Looking at share markets in Asia from yesterday’s session, where mainland Chinese shares were down solidly with the Shanghai Composite closing 1.7% lower at 3429 points while the Hang Seng Index lost 3% as fear gripped, closing at 22901 points. Price action on the daily chart shows how this massive retracement has crushed through the previous support level at 24000 points and then monthly support (lower black line) at the 22600 point level. We could see a quick bounceback on short covering here in response to moves on Wall Street overnight as volatility remains very high:
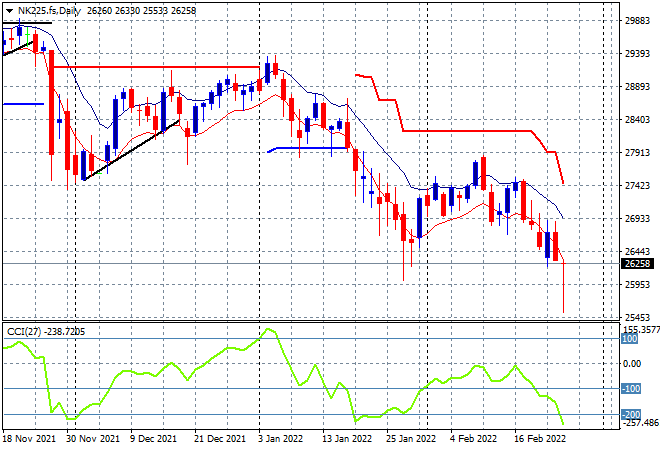
Japanese stock markets came back from holidays at the wrong time with the Nikkei 225 down nearly 2% to 25970 points but some of this could be clawed back in the final session of the week with futures suggesting a pull back to the 26000 point level. The daily chart is not looking good and a much higher Yen is not helping either. Price remains anchored here at or below the January lows where the previous level of support at around the 27000 point level has turned into resistance instead:
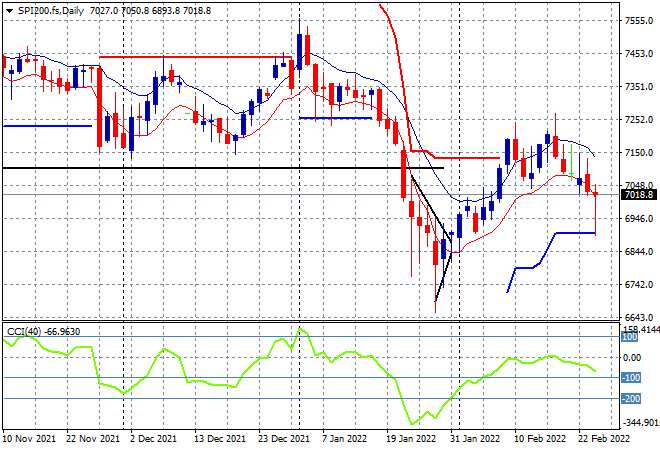
Australian stocks suffered a similar fate, with the ASX200 closing 3% lower to finish at 6990 points. SPI futures however are up around 1% on the bounceback on Wall Street, so we could finish the week above the 7000 point level. The daily chart remains fragile with considerable resistance still overhead at the previous weekly/monthly support levels as daily momentum rolls over from itsn never positive level and ATR support comes under stress next – its not over yet:
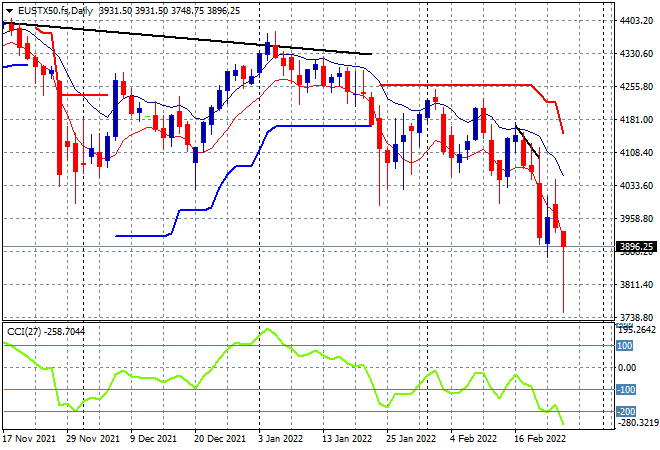
European shares had a wild session session, with the German DAX opening 5% lower while the Eurostoxx 50 index eventually finished 3.6% lower at 3829 points, with the daily futures chart showing a tiny amount of that clawed back as Wall Street bounced back post-close. The taking out of weekly ATR support at the 4000 point level which had been firming as a bottom here will be the critical area to watch in the coming sessions if the “buy the invasion/sell the news” actually works this time:
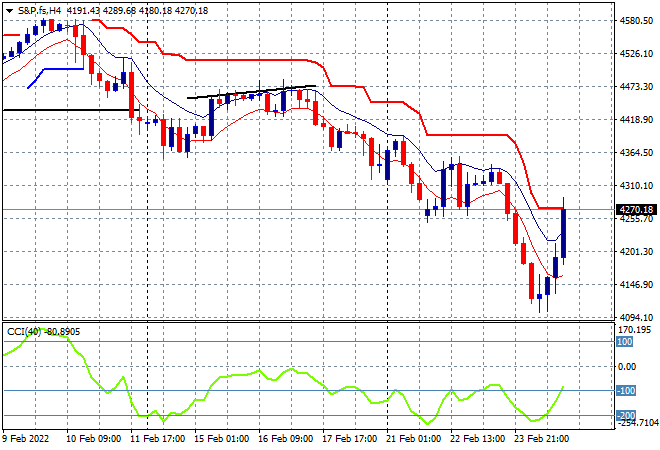
Wall Street bounced back on the announcement of even more US sanctions on Russia, with tech stocks leading the way, the NASDAQ actually gaining more than 3% while the S&P500 finished 1.5% higher at 4288 point. The four hourly chart shows how swift the BTFD team came in to support price here, almost taking it back to the start of week position, but not yet above the 4300 point level with more volatility expected tonight:
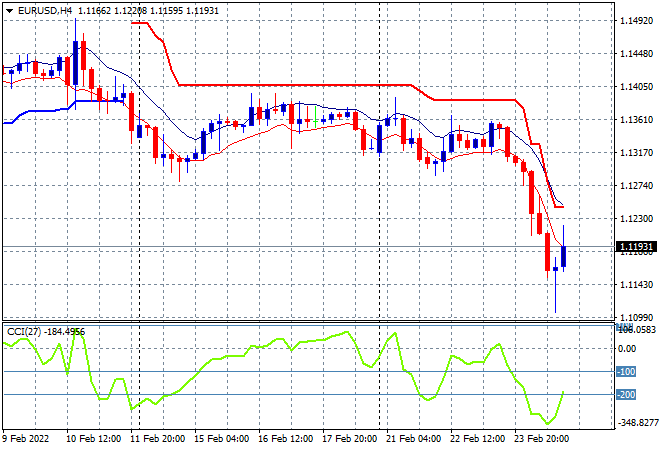
Currency markets were equally volatile with the USD index bouncing around with Euro falling swiftly to a two year low below the 1.11 handle before bouncing back to almost get above the 1.12 handle as of this morning. Watch for the inevitable dead cat bounce here as safe haven buying accelerates when Kiyv falls?
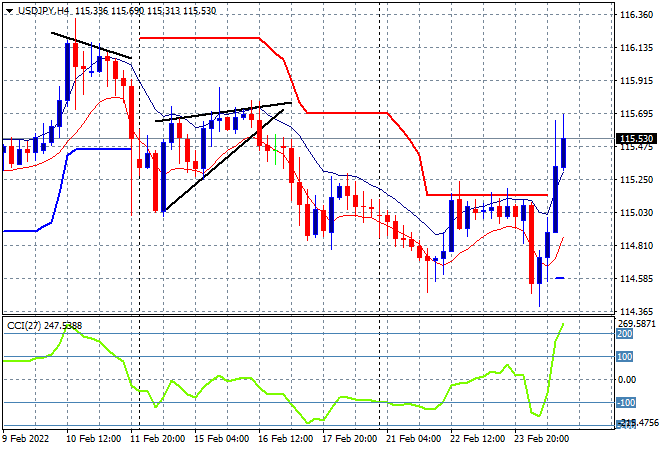
The USDJPY pair had been extremely contained but then fell sharply on Yen safe haven buying in the Asian session before a big reversal saw it bounce back almost to a two week high at the mid 115 level instead. Four hourly momentum has gone haywire, swapped to extreme overbought settings with overhead candle price action suggesting this move maybe over before it starts. Watch for a pullback to the 115 handle on Yen buying:
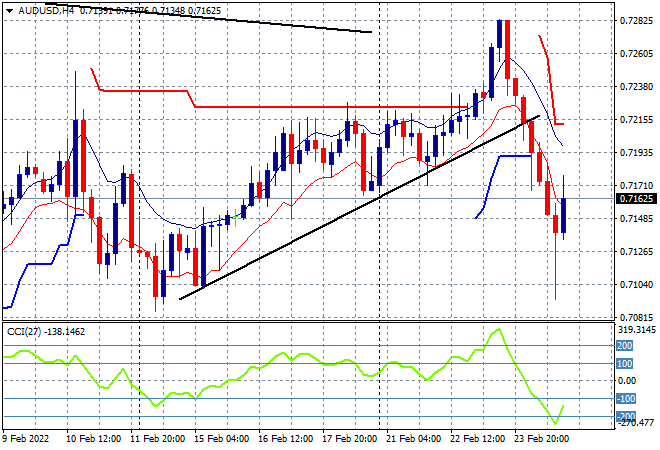
The Australian dollar continued to breakdown in the Asian session and then followed down towards the 70 handle during the London session before falling in step with the BTFD crowd on Wall Street earlier this morning. This could be shortlived with any falls in commodity prices on overbought action likely to result in a swift fallback for the Aussie so watch for a potential retracement below the low moving average on the four hourly chart here:
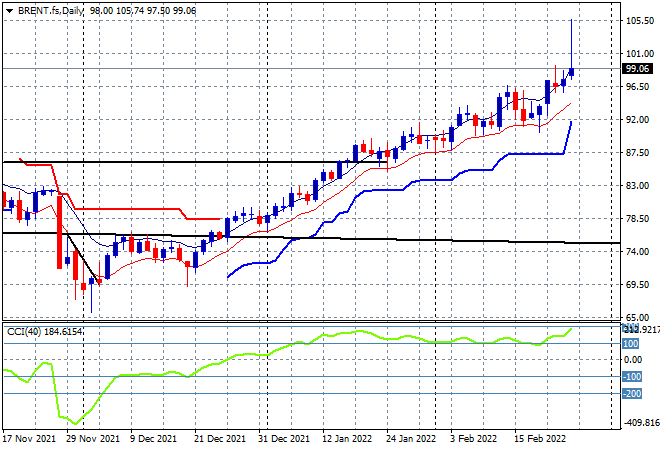
Oil markets had massive spikes on the invasion news with Brent crude surging through the $105USD per barrel level overnight before retracing to just below the key $100USD per barrel this morning. Volatility is rising here so profit taking may come next, so be wary of any further upside here before a minor retracement to take some heat out – but all bets are off!
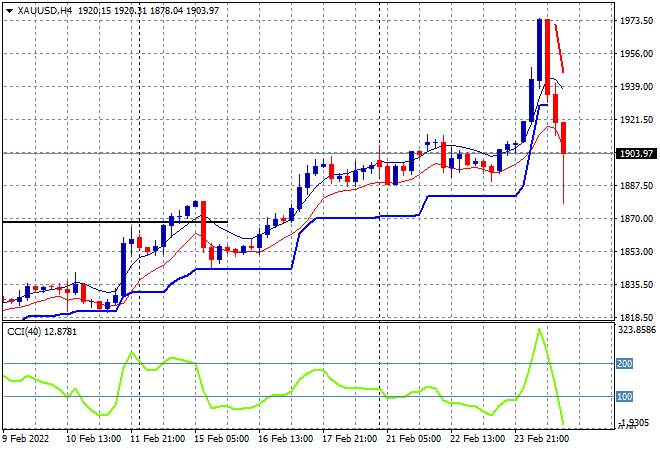
Gold had the wildest ride I think (and is the reason behind me not sleeping overnight) with a massive surge towards the $2000USD per ounce level before getting slammed through to the $1880 level – so nearly $200 in price volatility in the last 24 hours. As I said yesterday, I was aiming for a possible retracement back down to the $1870 level and here it is, but will there be stability from here on in and another rise back above $1900 or more downside?
Glossary of Acronyms and Technical Analysis Terms:
ATR: Average True Range – measures the degree of price volatility averaged over a time period
ATR Support/Resistance: a ratcheting mechanism that follows price below/above a trend, that if breached shows above average volatility
CCI: Commodity Channel Index: a momentum reading that calculates current price away from the statistical mean or “typical” price to indicate overbought (far above the mean) or oversold (far below the mean)
Low/High Moving Average: rolling mean of prices in this case, the low and high for the day/hour which creates a band around the actual price movement
FOMC: Federal Open Market Committee, monthly meeting of Federal Reserve regarding monetary policy (setting interest rates)
DOE: US Department of Energy
Uncle Point: or stop loss point, a level at which you’ve clearly been wrong on your position, so cry uncle and get out!wrong on your position, so cry uncle and get out!