

Yet another night on uncertainty with European stock markets slugging there way through before Wall Street slumped on US sanctions on Russia’s invasion of Ukraine and increase geopolitical worries around the globe. The USD index was up 0.2% for the night, Euro slipping despite a big inflation print that was mainly all energy price related while Yen safe haven buying abated due to the holiday in Japan as the Australian dollar round tripped through the volatility and yesterday’s wage price shenanigans. US bond markets saw a surge in yields with the 10 year Treasury rising again up through the 2% level while Brent crude oil remained high at the $97USD per barrel as copper fell back, while gold remains well above the $1900USD per ounce level.
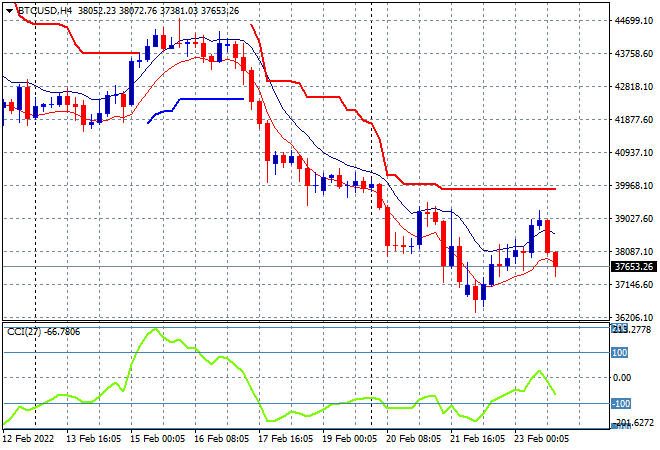
Bitcoin was unable to stabilise a little overnight, pulling back on the short term charts to retrace below the $38K level, as the overall chart setups continue to not look good for the digital gold wannabe. The four hourly chart shows a potential retracement down to the $36K level and then the $32K overshoot lows from early January next if it fails to clear upside ATR resistance at the $40K level quickly:
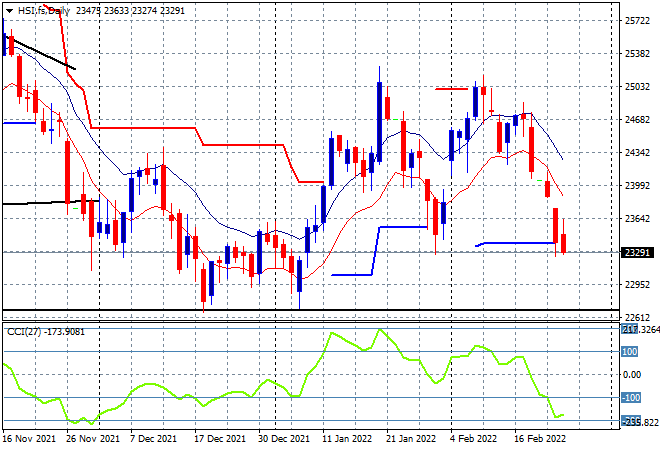
Looking at share markets in Asia from yesterday’s session, where mainland Chinese shares saw a boost straight after the lunch break with the Shanghai Composite climbing 0.9% in a straight line to finish 3489 points while the Hang Seng Index tried to make a comeback, finishing 0.6% higher at 23660 points. Price action on the daily chart shows a massive retracement here taking price well below the previous support level at 24000 points as momentum moves into oversold mode. This short term setup could resolve in a quick bounceback on short covering here as volatility remains very high:
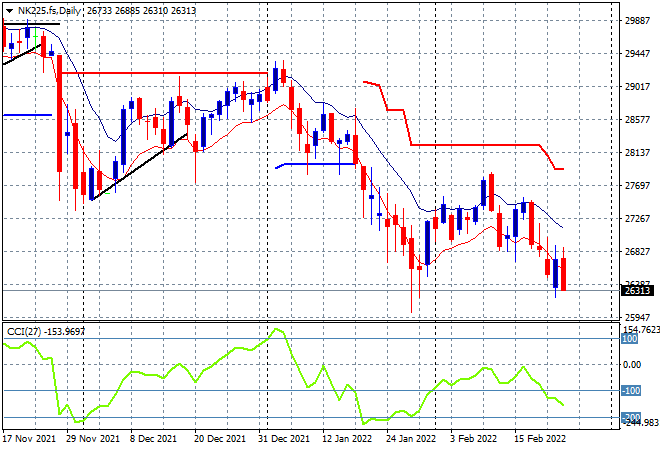
Japanese stock markets had another day off for a holiday with Nikkei 225 futures suggesting a pulldown back to the 26000 point level and the January intrasession lows is more than possible as Yen buying may accelerate here on the resumption of trade. Price has wanting to be anchored here at the January lows where the previous level of support at around the 27000 point level has turned into resistance instead:
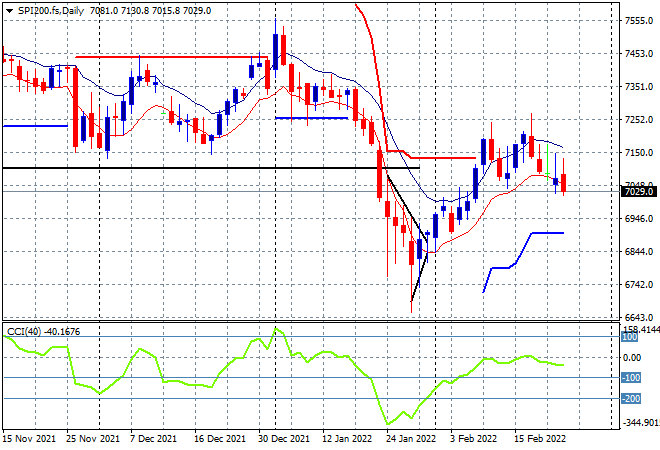
Australian stocks did a good job of filling in the short covering with the ASX200 gaining 0.6% to finish at 7205 points. SPI futures are down more than 1.2% on the slump on Wall Street, with the daily chart still showing a relatively fragile setup as considerable resistance overhead at the previous weekly/monthly support levels failed to clear. Daily momentum also has not been positive since this reflation trade started, with the signs of a rollover confirmed if price closes below the low moving average again here:
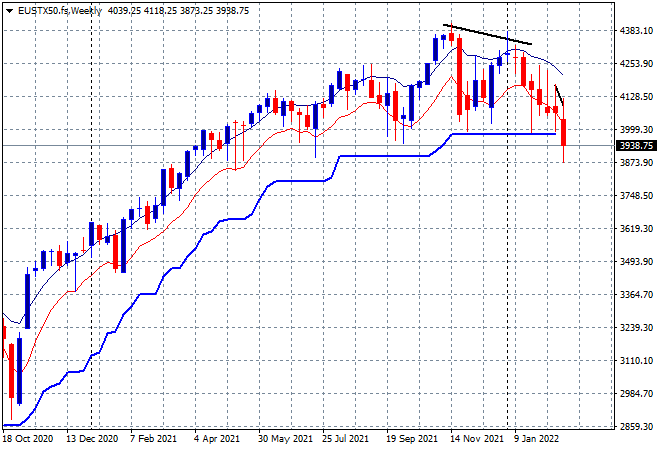
European shares had yet another mixed session, falling at the close as Putin kept everyone on their toes again, with intrasession volatility increasing. The Eurostoxx 50 index eventually finished 0.3% lower at 3973 points, but the weekly chart shows how weekly ATR support at the 4000 point level which was possibly firming as a bottom here as been definitively broken through and could set the stage for a proper correction from here:
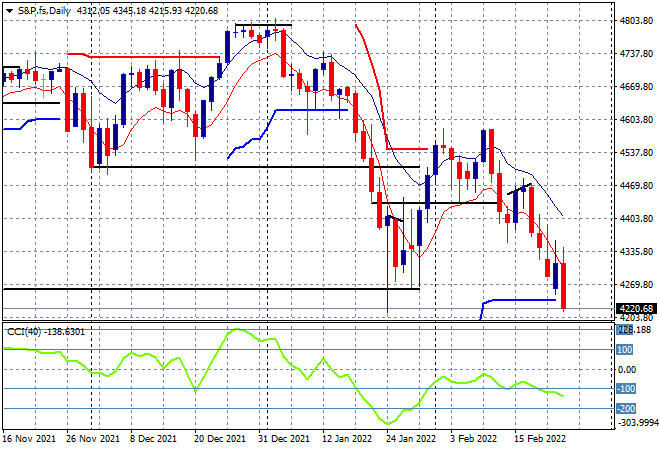
Wall Street fell on the announcement of more US sanctions on Russia, with tech stocks leading the way, the NASDAQ down 2.5% to just over 13000 points, while the S&P500 finished 1.8% lower at 4225 points even. The daily chart shows a correction now underway, having fallen over 12% since the December high and breaking through the January lows again as support at the 4250 level evaporates, setting up a long term bearish reversal pattern that is matched by the NASDAQ:
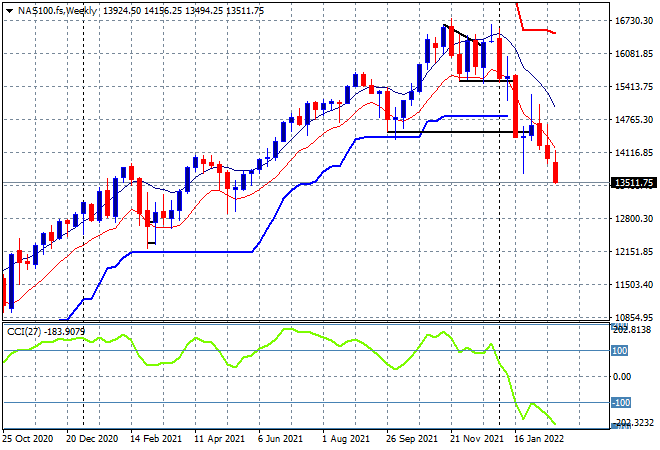
The weekly chart of NASDAQ is ominous indeed:
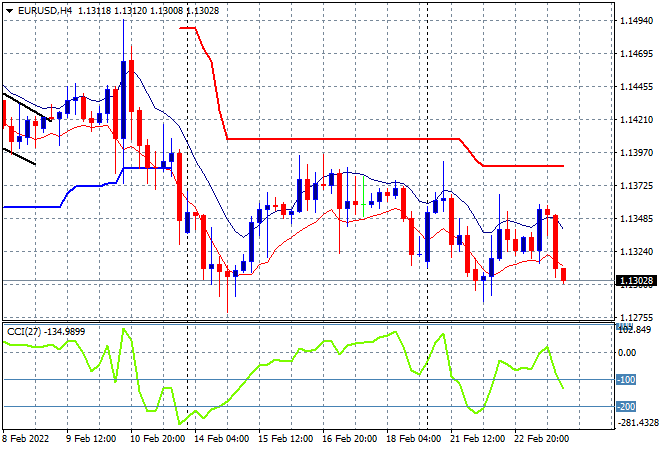
Currency markets remain volatile with the USD index inverting overnight on geopolitical messiness with a mild uplift, but the signs are there of some big shifts in direction. Euro was hovering at its previous weekly lows around the 1.13 handle, but retraced overnight back down to that level as the lack of any upside action is weighing on the union currency. There is the potential to fall back even further to the mid 1.12 level here as safe haven buying accelerates:
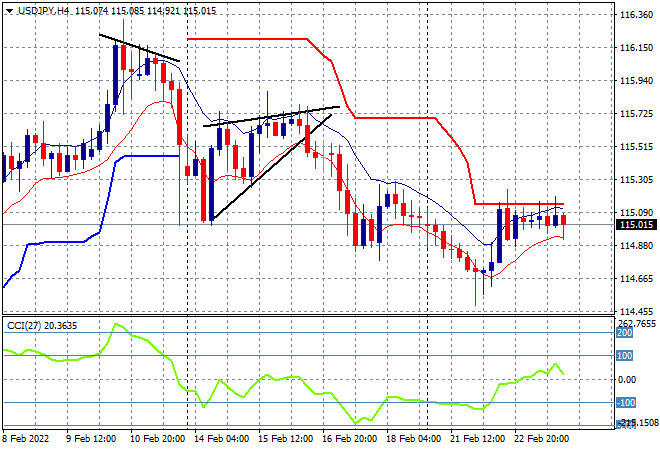
The USDJPY pair was extremely contained with almost no intrasession volatility, maintaining a weak position here just on the 115 handle overnight, although it may have been due to low volume as Japanese traders were on holidays. Momentum has inverted from its oversold status and pushed higher and is nominally positive but trailing ATR resistance overhead is not yet cleared. This could be very short lived so watch for a breakdown today below the 115 handle on Yen buying:
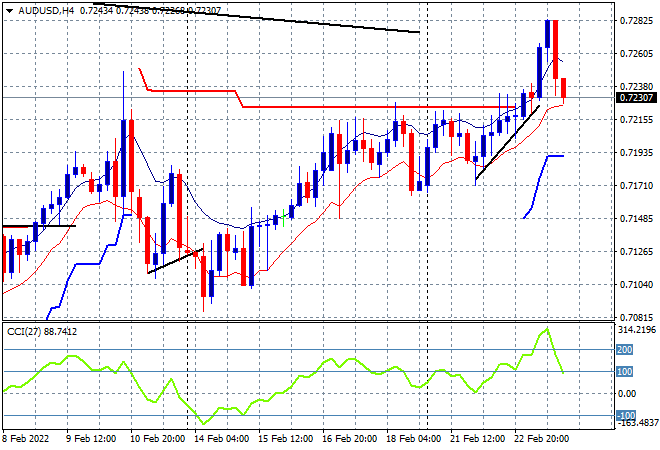
The Australian dollar broke out sharply in the Asian session and then accelerated higher before getting slammed back down following the US sanctions announcement, heading back to the low 72 level and still above previous overhead ATR resistance. The rise in oil and iron ore prices is still giving more momentum to the Aussie but can it push through here and hold on to a new weekly high or has it lost its shot already as another safe haven? I’m watching for a further retracement below the low moving average on the four hourly chart here:
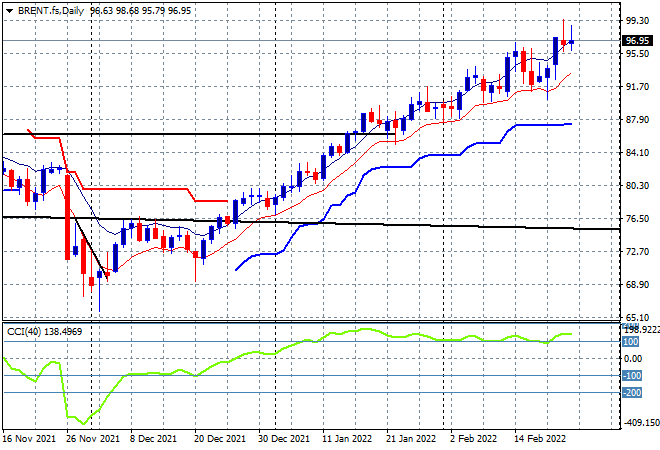
Oil markets continue to spike again on war concerns with Brent crude lifting up towards the $99USD per barrel level overnight before retracing yet again to steady at just below the $97 level instead. Price remains at a near decade high and remaining well on trend as the next target at $100USD per barrel remains in contention, as sanctions fallout come next. As does volatility so be careful here:
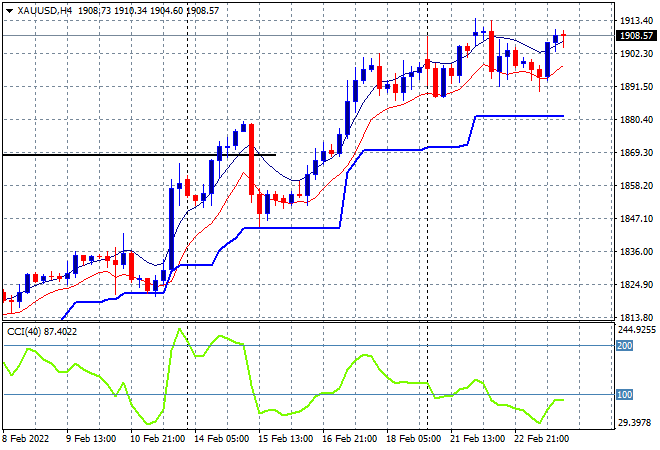
Gold remains somewhat contained here above the $1900USD per ounce level, pushing up again overnight on safe haven bids as it remains well above its October 2021 highs (top black horizontal line). The recent pause took some heat out of daily momentum readings, which were considerably overbought and while I’m still watching for a possible retracement back down to the $1870 level on good news in Ukraine, it’s looking like good news is a long way away:
Glossary of Acronyms and Technical Analysis Terms:
ATR: Average True Range – measures the degree of price volatility averaged over a time period
ATR Support/Resistance: a ratcheting mechanism that follows price below/above a trend, that if breached shows above average volatility
CCI: Commodity Channel Index: a momentum reading that calculates current price away from the statistical mean or “typical” price to indicate overbought (far above the mean) or oversold (far below the mean)
Low/High Moving Average: rolling mean of prices in this case, the low and high for the day/hour which creates a band around the actual price movement
FOMC: Federal Open Market Committee, monthly meeting of Federal Reserve regarding monetary policy (setting interest rates)
DOE: US Department of Energy
Uncle Point: or stop loss point, a level at which you’ve clearly been wrong on your position, so cry uncle and get out!wrong on your position, so cry uncle and get out!