

Risk markets stumbled on the opening of the trading week overnight, absorbing the latest Putin machinations over Ukraine with Wall Street having a long weekend not helping to dampen volatility due to thinner trading volumes. While the USD index was unchanged, Euro and Pound Sterling fell back, offset by higher Yen as safe haven buying did not stop overnight, with the Australian dollar retreating below the 72 handle once more. US bond markets were closed but futures are implying that the 10 year Treasury yield will retrace a little closer to the 1.9% level while commodity markets were buoyant, with oil prices lifting nearly 3%, while copper fell back and gold held on to its recent gains to remain near the $1900USD per ounce level.
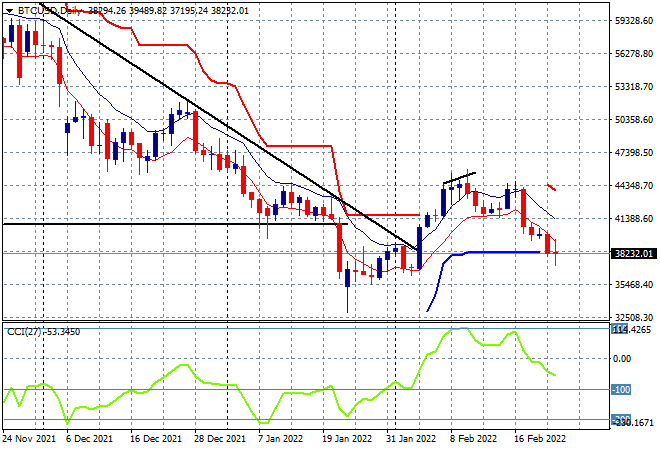
Bitcoin was pushed lower again, almost back to its start of year position at just above the $38K level, making a new monthly low in the process. The daily chart does not look promising with a further retracement down to the $32K overshot lows from early January possible:
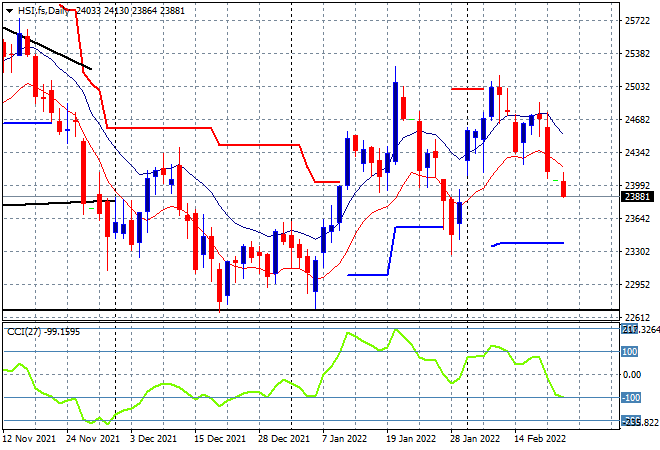
Looking at share markets in Asia from yesterday’s session, where mainland Chinese shares were dropping going into the close but the Shanghai Composite recovered with a scratch session to finish flat at 3490 points while the Hang Seng Index lost ground again, down 0.6% to 24170 points. Price action on the daily chart is very clear as resistance at the 25000 point level strengthens and support breaks at the 24000 level instead, confirming a double top bearish pattern. Watch for further closes below the low moving average on the daily chart as momentum moves into oversold mode:
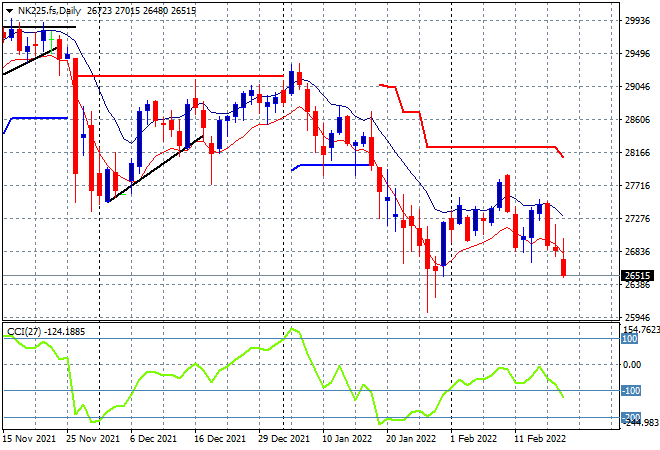
Japanese stock markets also pulled back with the Nikkei 225 finishing 0.7% lower to close at 26910 points. Futures are suggesting another gap down to bring price back to the January lows to try to test out another level of support, the former at around the 27000 point level evaporating. The daily chart indicates a complete rollover is building after momentum never went positive in the recent relief rally:
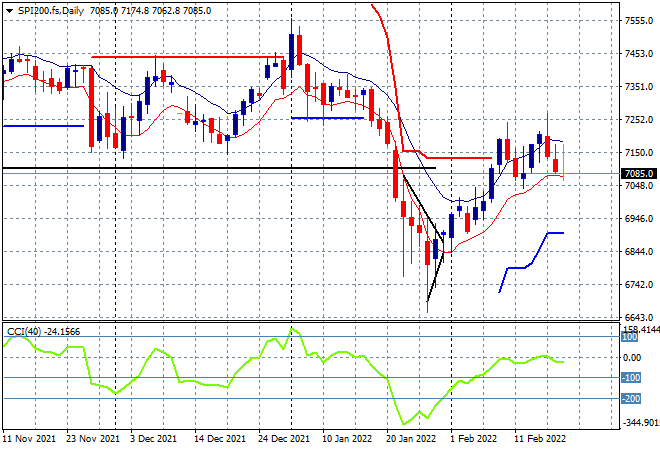
Australian stocks were the best in the region, as the ASX200 actually gained nearly 0.2% to climb to 7233 points. SPI futures are down more than 1% with the daily chart showing how fragile this melt up rally looks, with price action still failing to substantially clear above the previous weekly/monthly support levels. Daily momentum also has not been positive since this reflation trade started, with the signs of a rollover confirmed if price falls below the low moving average here:
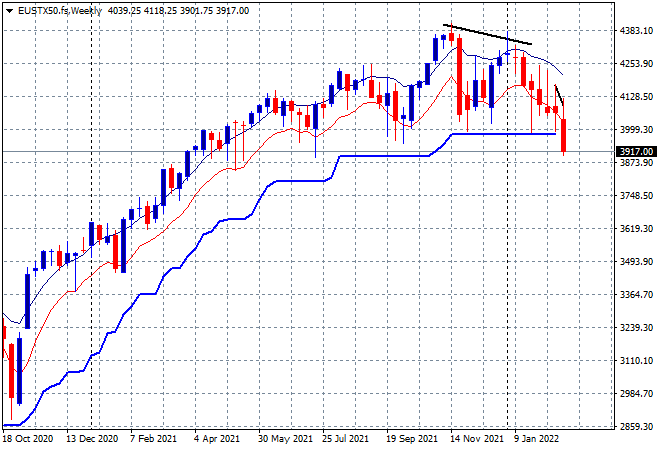
European shares stumbled again as the threat of war in Ukraine did not let up, increasing downside volatility with the Eurostoxx 50 index losing more than 2% to fall below the 4000 point level, exceeding the January lows. The weekly chart is quite illustrative of whats going on here with weekly ATR support at the 4000 point level taken out and price ready to drop further if the conflict is not resolved soon:
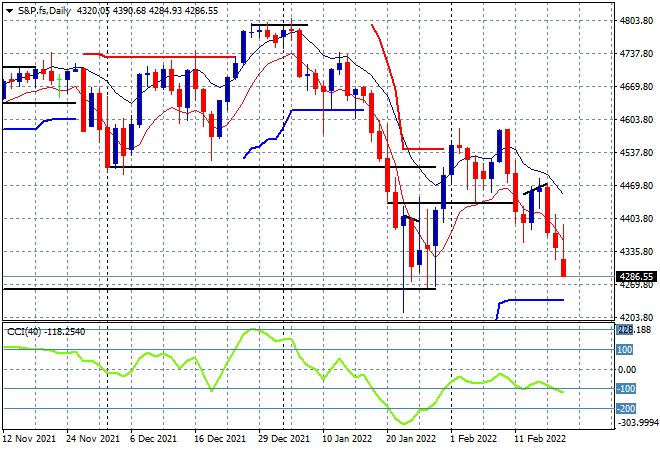
Wall Street was closed for the long weekend holiday with futures indicating a return to the January lows with a 1-2% loss on the open expected tonight for the S&P500, bringing it back to the mid 4200 point level. The daily futures chart shows that the 4250 level will come under threat next, setting up a long term bearish reversal pattern that is matched by the NASDAQ:
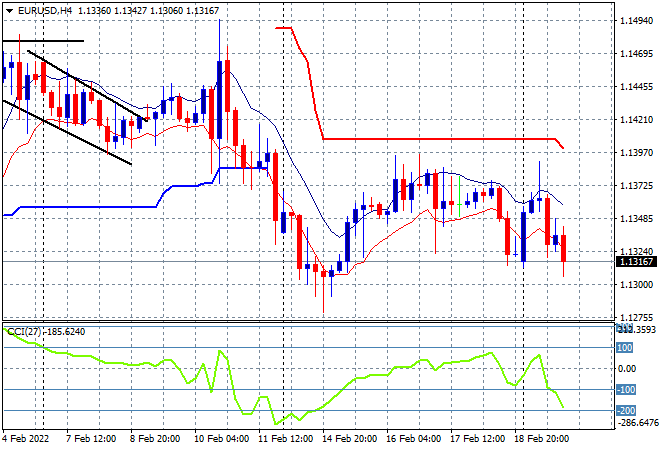
Currency markets remain volatile while the USD index is giving mixed signals, there’s definite caution in Euro-land as the situation in Ukraine turns dire. The safe haven bid continues with Euro again returning to the previous weekly lows around the 1.13 handle, retracing below the previous Friday night lows as well. There is the potential to fall back even further to the mid 1.12 level here as safe haven buying accelerates:
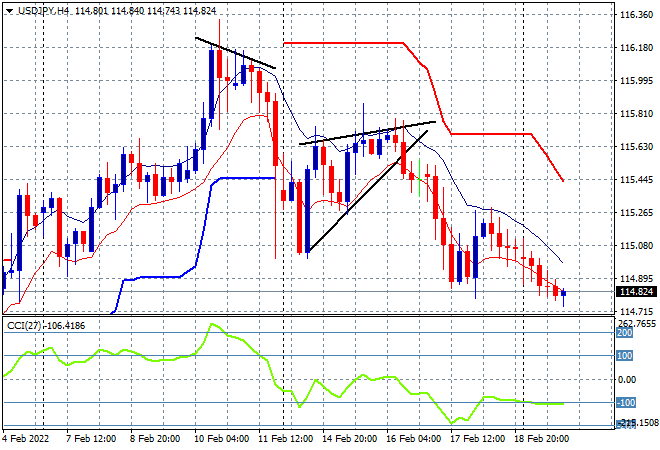
The USDJPY pair continued to slide down from its Friday deflationary trade, still following the successful conclusion of the bearish rising wedge pattern on the four hourly chart, as Yen safe haven buying is not yet over. Momentum is somewhat oversold as I remain very cautious as this pattern looks ripe for more downside as the 115 handle is breached:
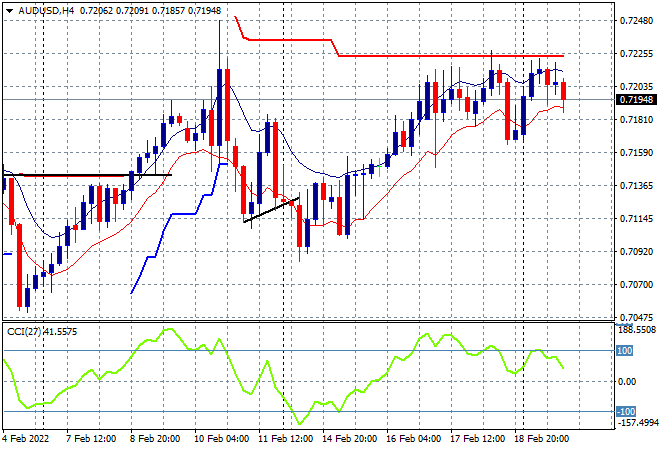
The Australian dollar is keeping its ground but only just, still failing to punch through the 72 handle with the four hourly chart showing a series of highs that is just not making any dent on overhead ATR resistance. The rise in oil and iron ore prices versus the rush to USD is keeping this pair contained for now, with the four hourly chart showing this trend not having any momentum with price looking to anchor back down to the mid 71 level with the possibility of overshooting down to the 71 handle:
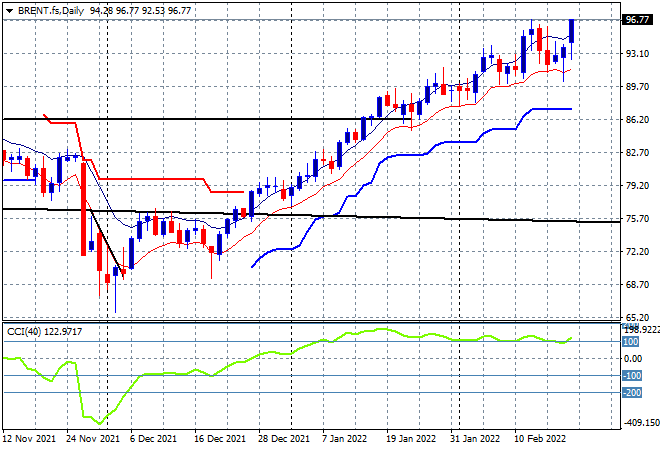
Oil markets have spiked up again on war concerns with Brent crude lifting nearly 3% to break above the $96USD per barrel level, pushing further into its near decade high and remaining well on trend. The next target at $100USD per barrel could still be in contention, with momentum not stopping anytime soon, but continue to watch the low moving average on the daily chart for signs of any profit taking:
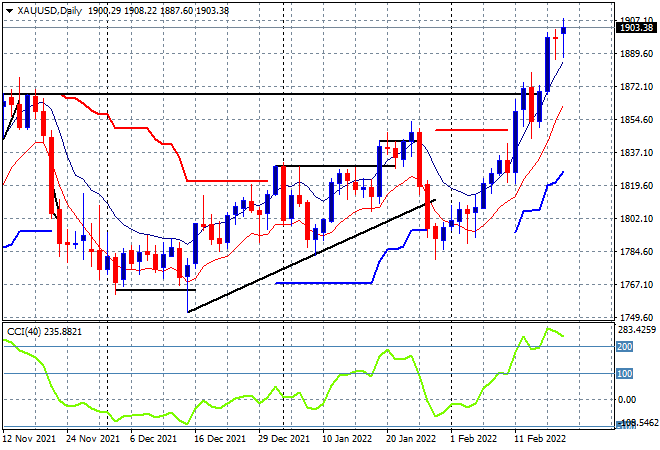
Gold cannot be contained either, pushing through the $1900USD per ounce level, still exceeding its October 2021 highs (top black horizontal line) despite daily and weekly momentum being considerably overbought and unsustainable. I’m watching for a possible retracement back down to the $1870 level on good news in Ukraine, but this may not eventuate as Putin moves his chess pieces around:
Glossary of Acronyms and Technical Analysis Terms:
ATR: Average True Range – measures the degree of price volatility averaged over a time period
ATR Support/Resistance: a ratcheting mechanism that follows price below/above a trend, that if breached shows above average volatility
CCI: Commodity Channel Index: a momentum reading that calculates current price away from the statistical mean or “typical” price to indicate overbought (far above the mean) or oversold (far below the mean)
Low/High Moving Average: rolling mean of prices in this case, the low and high for the day/hour which creates a band around the actual price movement
FOMC: Federal Open Market Committee, monthly meeting of Federal Reserve regarding monetary policy (setting interest rates)
DOE: US Department of Energy
Uncle Point: or stop loss point, a level at which you’ve clearly been wrong on your position, so cry uncle and get out!wrong on your position, so cry uncle and get out!