

Share markets slumped again on Friday night as risk taking remains fragile in light of the growing conflict in Ukraine and more hawkish comments from Fed officials. The USD index again bounced back, up more than 0.3% as safe haven searching continued, with the Australian dollar falling back sharply as the 10 year Treasury yield also retraced to the 1.92% level with interest rate futures now only suggesting a 20% chance of a 50 bps rise by the Fed next month. Commodity markets were mixed, with oil prices lifting slightly while copper fell back and gold held on to its recent gains to remain near the $1900USD per ounce level.
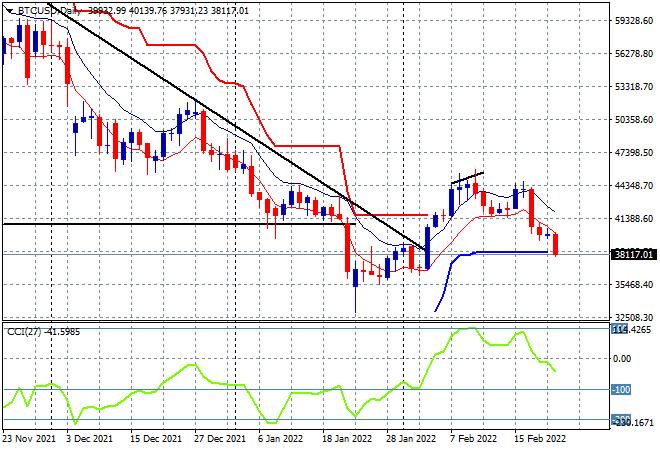
Bitcoin was pushed far lower, almost back to its start of year position at just above the $38K level, making a new monthly low in the process. Finally, volatility has caught up to real currencies as daily momentum switched to the negative side as a further retracement down to the $32K is possible:
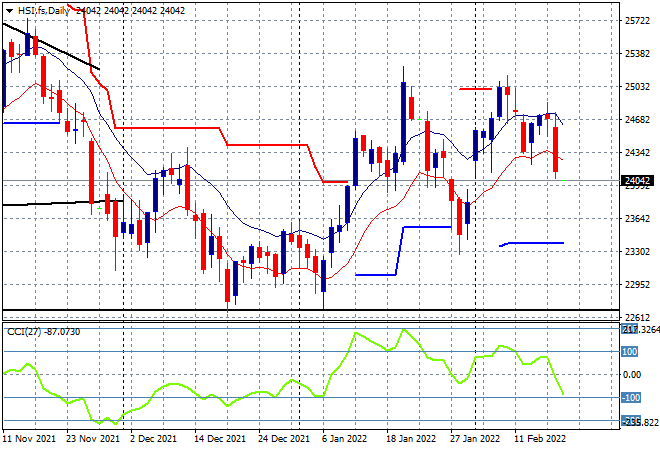
Looking at share markets in Asia from Friday’s session, where mainland Chinese shares were mixed to start with but then got a wriggle on with the Shanghai Composite finishing up 0.6% to 3490 points while the Hang Seng Index went the other way and sold off sharply at the close, down 1.8% to 24327 points. Price action on the daily chart is now looking clearer as resistance at the 25000 point level firms and support breaks at the 24000 level instead, nearly confirming a double top bearish pattern. Watch for another close below the low moving average on the daily chart:
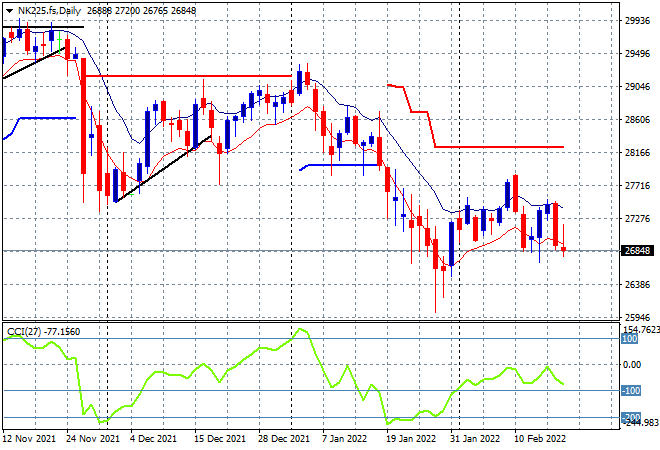
Japanese stock markets also pulled back with the Nikkei 225 finishing 0.4% lower to close at 27121 points. Futures are suggesting another gap down to start the trading week with support evaporating at around the 27000 point level with the daily chart indicating a complete rollover is building after momentum never went positive in the recent relief rally. A return to the January lows remains the dominant direction:
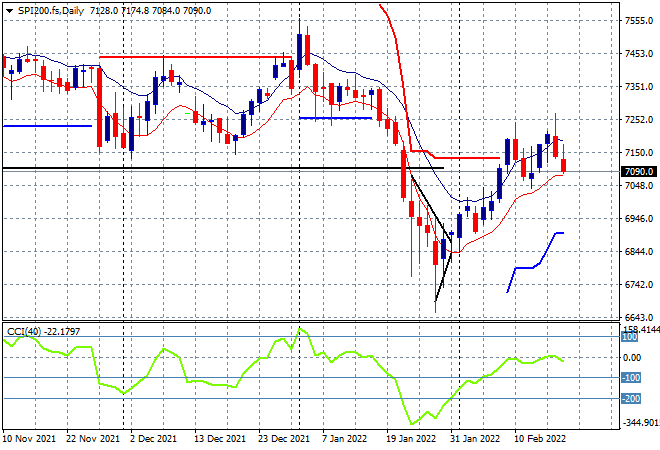
Australian stocks were nearly the worst in the region, as the ASX200 lost 1% to finish the week at 7221 points. SPI futures are down over 50 points or nearly 1% with the daily chart showing how fragile this melt up rally looks, with price action still failing to substantially clear above the previous weekly/monthly support levels. Daily momentum has not been positive since this reflation trade started, with the signs of a rollover coming to the fore again as risk sentiment sours:
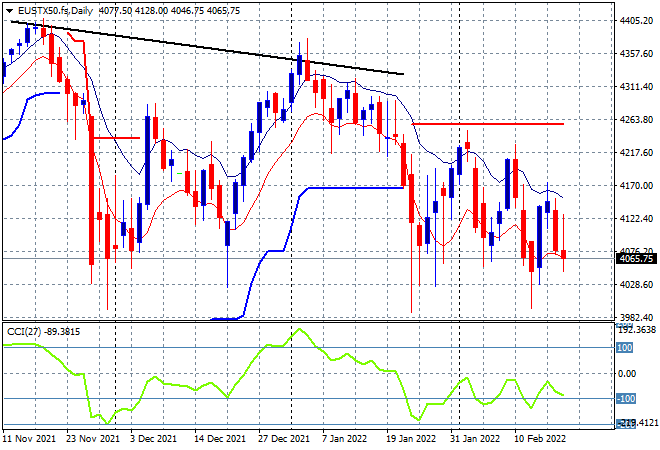
European shares stumbled again as the end of the trading week came to a close with the Eurostoxx 50 index losing 0.9%, as the German DAX lost over 1.3%, pulling markets back to their January lows again, the former finishing at 4074 points. The January surge towards the 4300 point level has evaporated as markets remain distrustful of Russia’s moves in Ukraine, as price has fully retraced back to tentative support at the 4000 point level with the series of lower daily highs accelerating here as a correction is imminent:
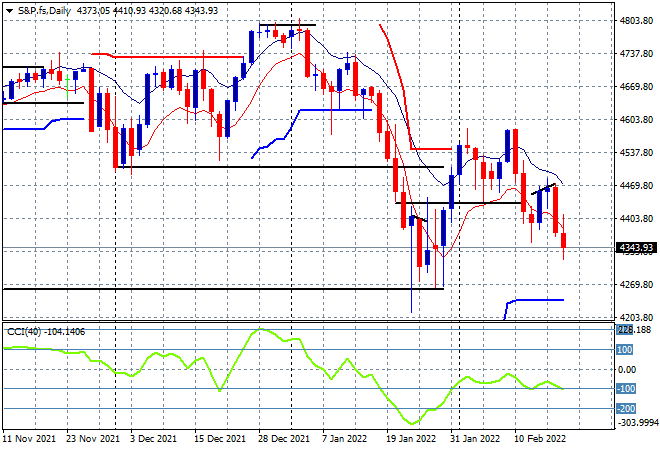
Wall Street also couldn’t find any confidence, selling off into the close with the NASDAQ down 1.2% while the S&P500 lost 0.7% to finish at 4348 points. The daily chart shows how the previous relief rally never got any positive momentum as well despite a false break up towards the 4600 point level with all indications that the 4250 level will come under threat next, setting up a long term bearish reversal pattern:
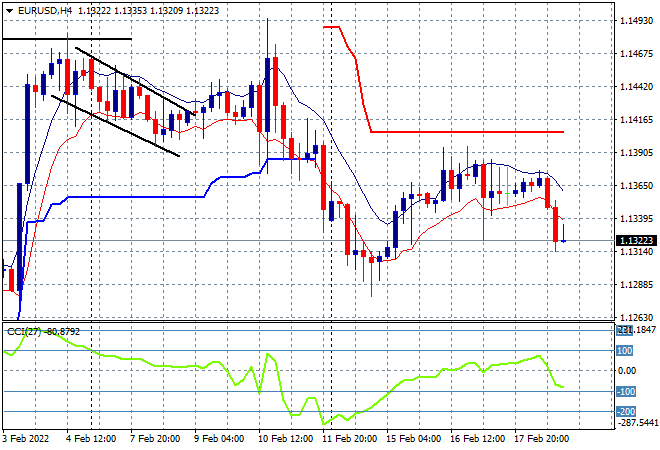
Currency markets increased in volatility on Friday night as the situation in Ukraine hastened towards open conflict with the USD strengthened considerably on the safe haven bid and yet more hawkish comments from Fed officials. Euro returned back to its start of week position just above the 1.13 handle, keeping below the previous Friday night lows, putting in a new weekly low in the process. There is the potential to fall back even further to the mid 1.12 level here as safe haven buying accelerates:
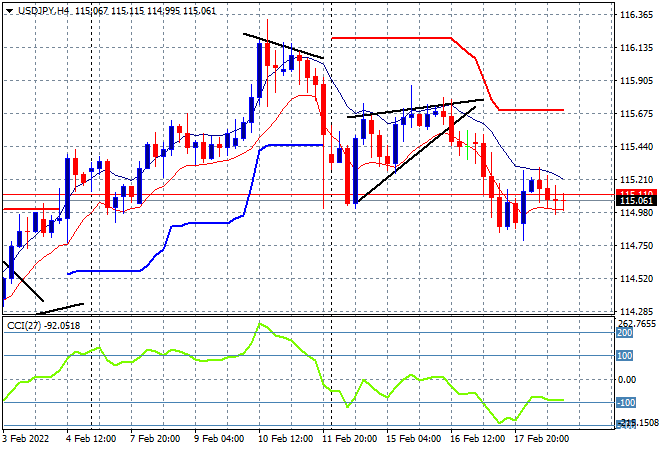
The USDJPY pair continued to slide sideways after pulling back mid week following the successful conclusion of the bearish rising wedge pattern on the four hourly chart, finishing with a new weekly low as Yen safe haven buying is not yet over. Momentum is somewhat oversold as I remain very cautious as this pattern looks ripe for more downside as the 115 handle is breached:
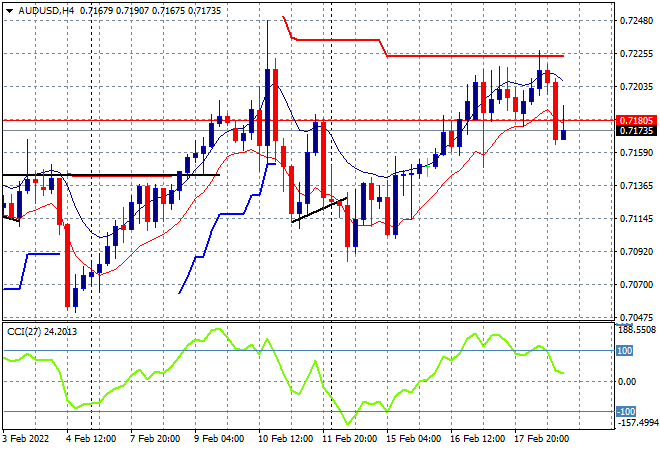
The Australian dollar pulled back sharply, after failing to punch through the 72 handle throughout the week and finished the week well below as the lack of positive risk sentiment as iron ore price volatility again spiked again. The four hourly chart showed this trend losing momentum before the pullback so this wasn’t surprising with price now anchoring back down to the mid 71 level with the possibility of overshooting down to the 71 handle:
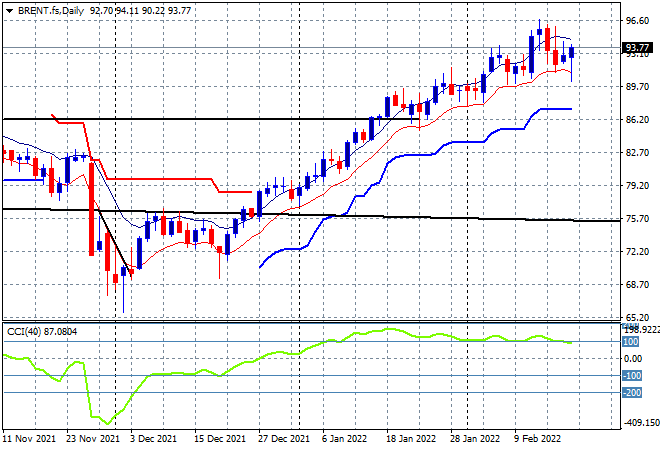
Oil markets continue to moderate somewhat although intrasession volatility pipped a bit higher on Friday night with Brent crude lifting slightly to finish just below the $94USD per barrel level, holding on to its near decade high and remaining on trend. The next target at $100USD per barrel could still be in contention, but this trend is now moderating momentum, so watch the low moving average on the daily chart for signs of any profit taking:
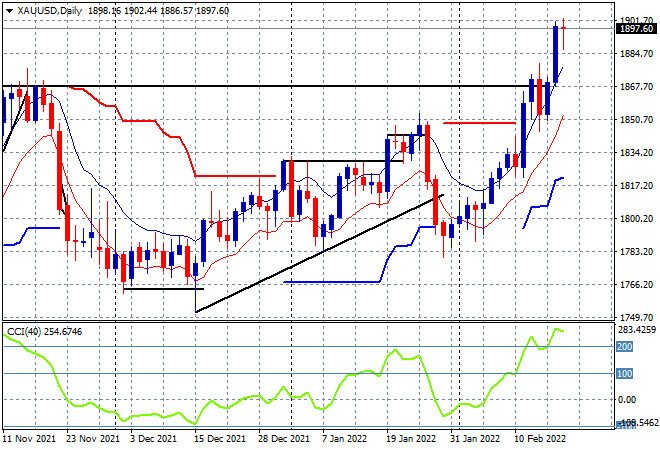
Gold was contained on Friday night, but staying right up at the $1900USD per ounce level, still exceeding its October 2021 highs (top black horizontal line) as it held on to this substantial breakout. Daily momentum is extremely overbought, as gold gets way ahead of itself again here so I’m watching for a possible retracement back down to the $1870 level again:
Glossary of Acronyms and Technical Analysis Terms:
ATR: Average True Range – measures the degree of price volatility averaged over a time period
ATR Support/Resistance: a ratcheting mechanism that follows price below/above a trend, that if breached shows above average volatility
CCI: Commodity Channel Index: a momentum reading that calculates current price away from the statistical mean or “typical” price to indicate overbought (far above the mean) or oversold (far below the mean)
Low/High Moving Average: rolling mean of prices in this case, the low and high for the day/hour which creates a band around the actual price movement
FOMC: Federal Open Market Committee, monthly meeting of Federal Reserve regarding monetary policy (setting interest rates)
DOE: US Department of Energy
Uncle Point: or stop loss point, a level at which you’ve clearly been wrong on your position, so cry uncle and get out!wrong on your position, so cry uncle and get out!