

Share markets started the trading week in a flap as rising concerns about a war in Eastern Europe saw European markets lose over 2% and Wall Street about to follow but a series of volatile moves due to hope and fear from various economic and political actors staved off a correction. Tech stocks finished flat while the rest of Wall Street escaped with a flesh wound. The USD index continued to flex its strength, up another 0.3% while the bond market was again looking to sell off with the 10 year Treasury yield pushed back above the 2% level with interest rate futures continuing to price in a possible 50 bps rise by the Fed next month. Commodity markets were mixed with energy concerns still pushing oil higher as Brent went up nearly 2%, while copper and iron ore sold off and gold lifted again on the safe haven bid.
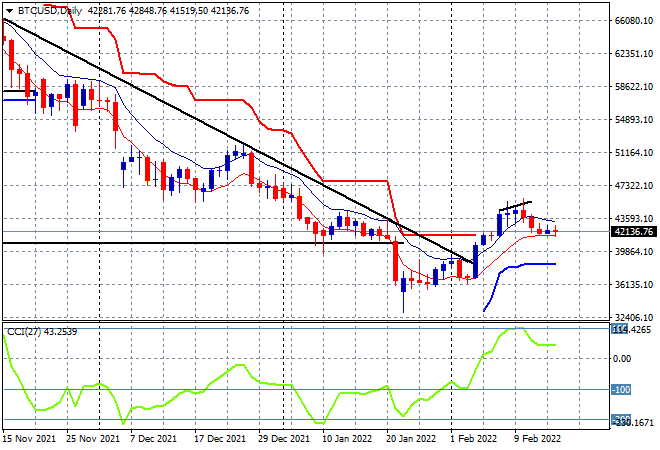
Bitcoin is literally going nowhere after its failure to breakout above the $45K level last week, remaining anchored here at the $42K level instead as it brushes off the wave of volatility across actual currency markets and continued its consolidation. Daily momentum has reverted to barely positive levels with the potential for a rollover building here:
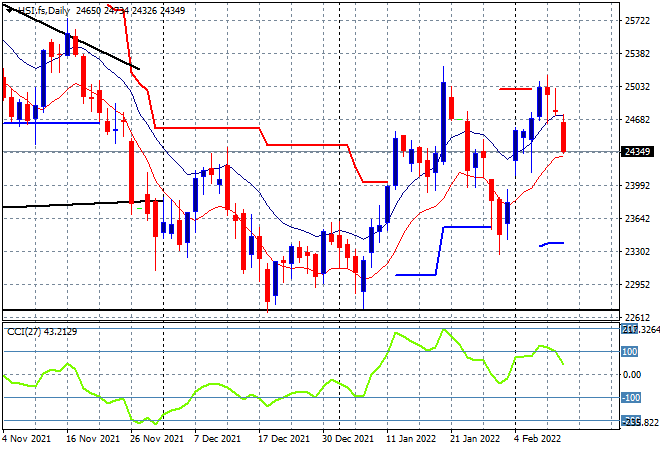
Looking at share markets in Asia from yesterday’s session, where mainland Chinese shares fell sharply going into the close with the Shanghai Composite down more than 0.9% at 3428 points while the Hang Seng Index did even worse, down 1.4% at 24556 points. Price action on the daily chart still clearly shows it unable to clear the 25000 point level reached in mid January as momentum now inverts from its overbought stage with a double top bearish pattern forming again:
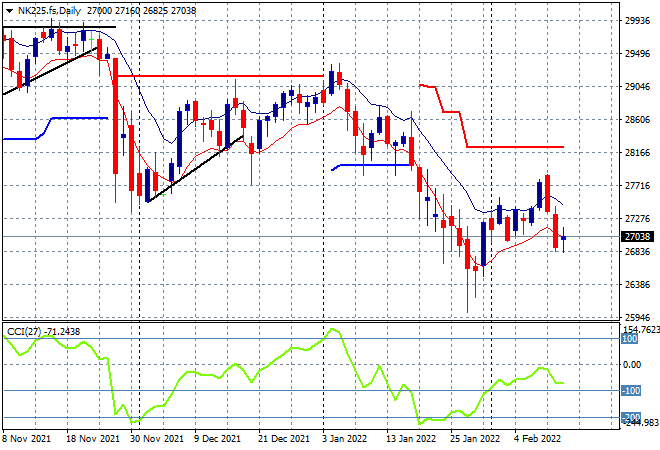
Japanese stock markets reopened from the long weekend but traders will wish they stayed closed with the Nikkei 225 losing over 2% to close at 27079 points. The daily chart is closing a bull trap here with this next phase of a dead cat bounce about to push below the 27000 point level which would then see a return to the January lows swiftly thereafter:
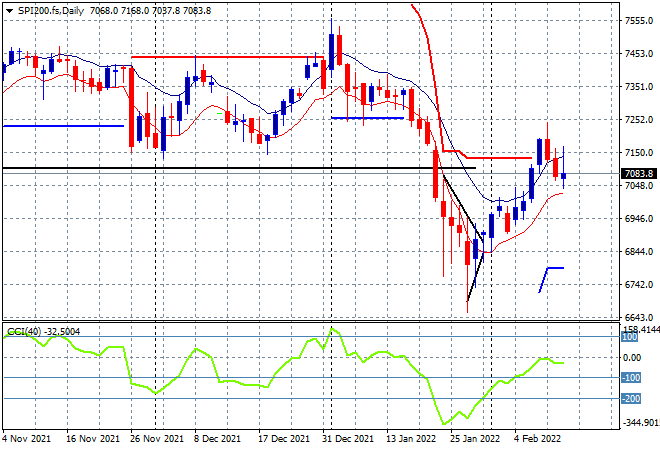
Australian stocks unexpectedly rose with the ASX200 finishing 0.3% higher at 7243 points. SPI futures however are looking a bit bleak, down nearly 1% due to the volatility on Wall Street overnight with price action unable to clear above the previous weekly/monthly support levels. Daily momentum has not been positive since this reflation trade started, so we’re likely to see more signs of a rollover with the added volatility from earnings season which ramps up today:
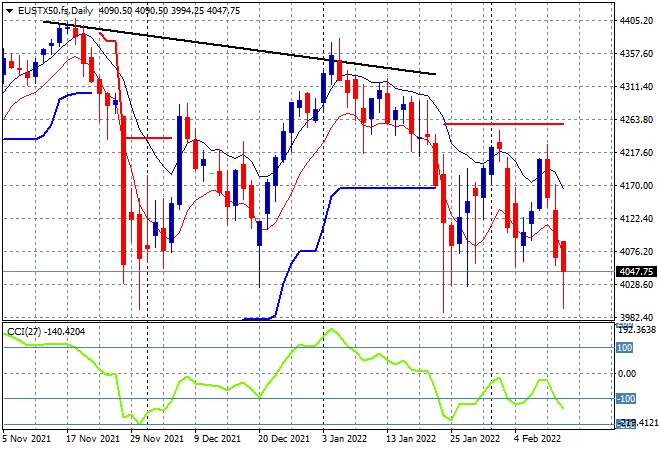
European shares were the worst performers overnight, as the Eurostoxx 50 index lost more than 2%, finishing at 4064 points, although it cracked the 4000 point level intrasession as Wall Street had very large volatility towards the end of its own session, as the war drums continue to beat across Eastern Europe. A much weaker Euro is not providing any support here in the short term as price action shows a series of lower highs as trailing overhead resistance at the 4250 point level firms once more. Watch the 4000 point level which must hold here to stave off a wider correction:
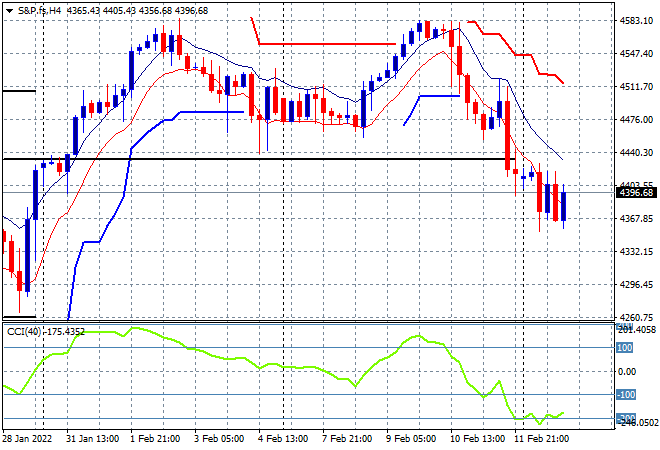
Wall Street had a wild ride overnight with the pre open futures suggesting major falls before rallying mid-stream and then taking it all back and then some at the close with only tech stocks getting away with a scratch. The NASDAQ finished dead flat, while the S&P500 lost 0.4% to close at 4401 points. The four hourly chart shows price retracing in a deflated pattern, unable to get back above the previous “bottom” highs at the 4440 level (mid black horizontal line). Momentum is on the deck but there are nascent signs of a recovery here so don’t discount the BTFD crowd stepping in soon, but for now all signs point to a return to those January lows:
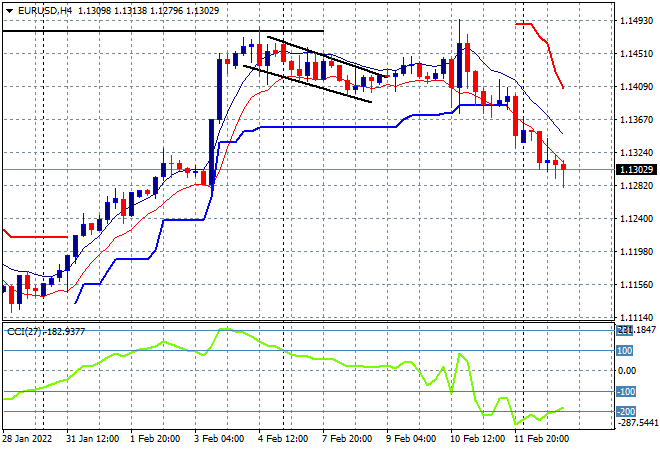
Currency markets had a yet another volatile night as King Dollar continued to flex its muscles against all the undollars, save gold. Euro continues to fall sharply in the wake of the Ukraine crisis, falling right down to the 1.13 handle. As I mentioned yesterday, there’s daylight below here as the four hourly trailing ATR support level was taken out on Friday with the potential to retrace well down to the 1.11 level or lower if things heat up:
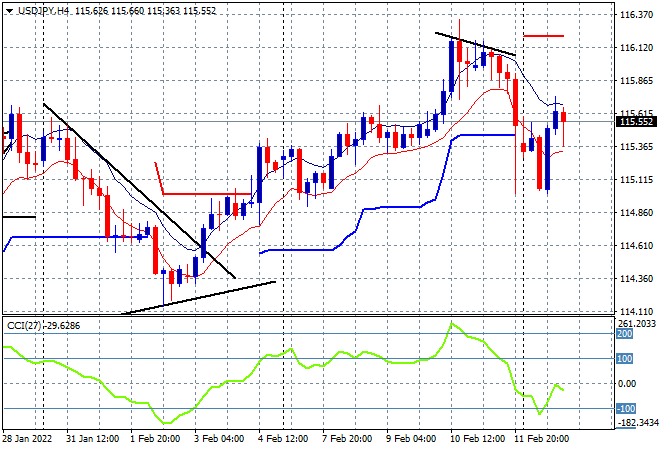
The USDJPY pair saw the greatest volatility with a selloff and then a big fill on the inversion of the safe haven run to Yen, getting back to the mid 115 level and above four hourly ATR support. Notably, momentum remains neutral at best and price is contained with the wide band of moving average lows and highs so this is hard to discern direction next, but any risk off moves will see more Yen buying so watch for a retracement below the mid 115 level again:
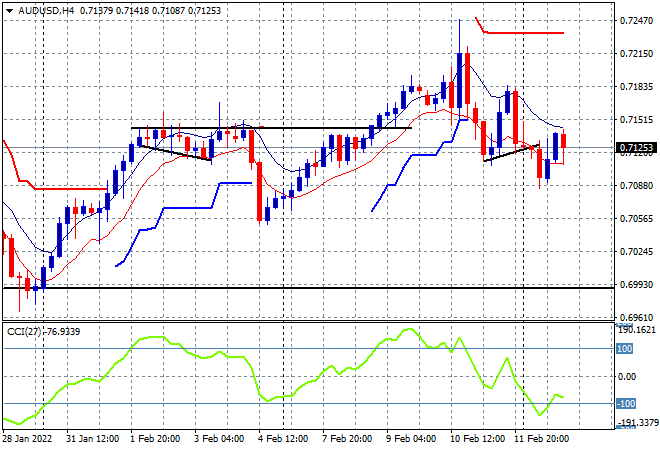
The Australian dollar had a similar ride but not the same magnitude, falling below the 71 handle before a late rebound saw it back near its recent weekly highs. The daily and four hourly chart is still showing a series of lower highs on these rebounds with momentum decidedly negative, so watch for another retracement and a potential selloff below the 71 level :
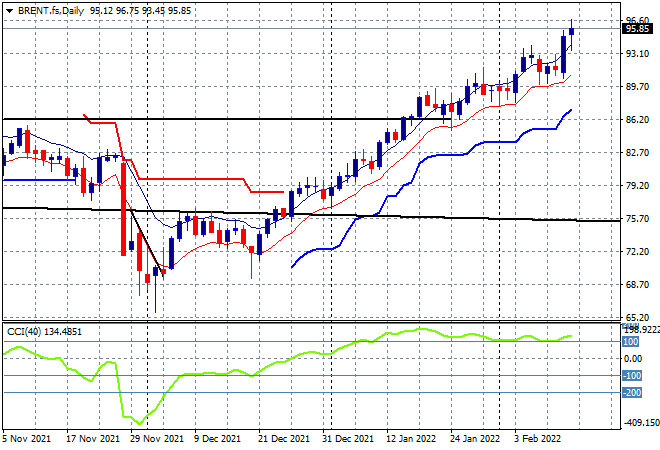
Oil markets really love war drums as energy prices remain elevated with Brent crude lifting nearly 2% to almost finish above the $96USD per barrel level overnight for a near decade high. The next target at $100USD per barrel was considered a step to far, as this recent breakout was overextended in the short term, but it could be just the first target if Ukraine falls into conflagration. Momentum remains considerably overbought:
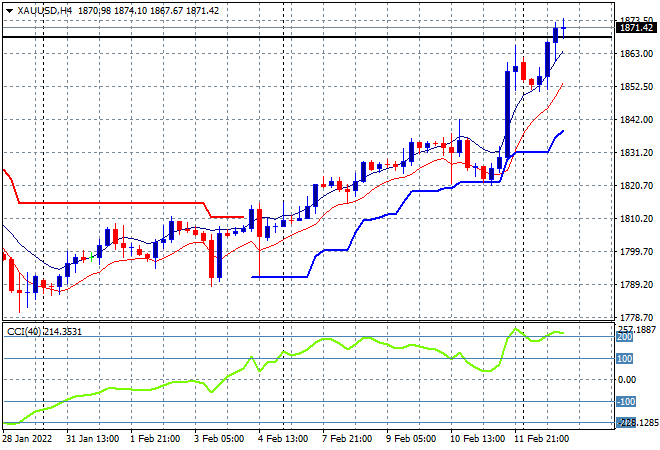
Gold remains the lone undollar that is bucking the trend with another solid up session overnight, pushing it above the $1870USD per ounce level for a new weekly and monthly high, actually exceeding its October 2021 highs (top black horizontal line). While the potential for a minor pullback remains, there seems to be nothing stopping the shiny metal for now:
Glossary of Acronyms and Technical Analysis Terms:
ATR: Average True Range – measures the degree of price volatility averaged over a time period
ATR Support/Resistance: a ratcheting mechanism that follows price below/above a trend, that if breached shows above average volatility
CCI: Commodity Channel Index: a momentum reading that calculates current price away from the statistical mean or “typical” price to indicate overbought (far above the mean) or oversold (far below the mean)
Low/High Moving Average: rolling mean of prices in this case, the low and high for the day/hour which creates a band around the actual price movement
FOMC: Federal Open Market Committee, monthly meeting of Federal Reserve regarding monetary policy (setting interest rates)
DOE: US Department of Energy
Uncle Point: or stop loss point, a level at which you’ve clearly been wrong on your position, so cry uncle and get out!wrong on your position, so cry uncle and get out!