
Wall Street continues to fall as earnings disappoint, despite a better than expected US GDP print and initial jobless claims with markets still pricing in a rate rise in March. European equities were better off but still relatively depressed, helped along by a much lower Euro as USD continues to flex its muscles against everything undollar, with gold the latest casaulty, now below the key $1800USD per ounce support level. Other commodity markets remain robust with Brent and WTI crude holding on at near decade highs while the 10 year Treasury yield fell back from its recent highs to 1.78% with Aussie interest rate futures indicating a May rate hike.
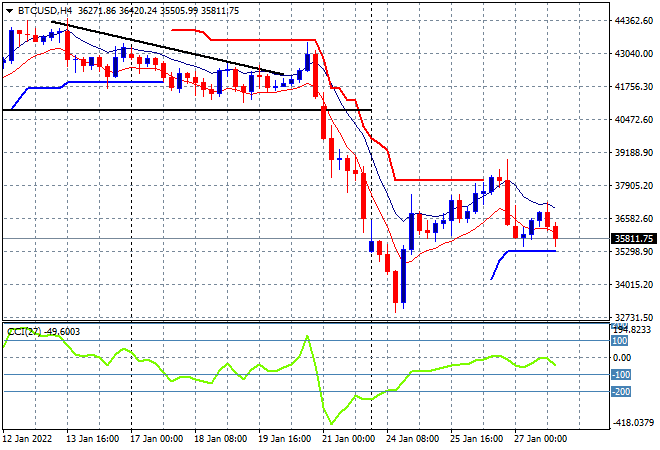
Bitcoin is failing in it recovery from the previous big selloff and is floundering here at just below the $36K level with the four hourly chart not looking promising at all. A classic dead cat bounce pattern suggests a bigger rollover is imminent, watch trailing ATR support at the $35K level to come under pressure next:
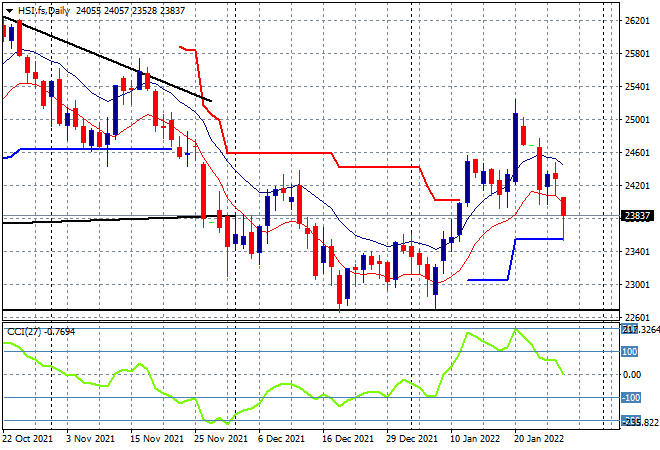
Looking at share markets in Asia from yesterday’s session, where mainland Chinese shares continued to fall back sharply with the Shanghai Composite down over 1.7%, closing at 3394 points while the Hang Seng Index fell even steeper, down 2% to close at 23807 points. This epic volatility takes out the previous support level that should’ve held here and sends clear signals that the previous breakout above the 24000 point level is not sustainable at all. While momentum is neutral, we need to see price action rebounding back above the 24600 point level at the high moving average before re-engaging:
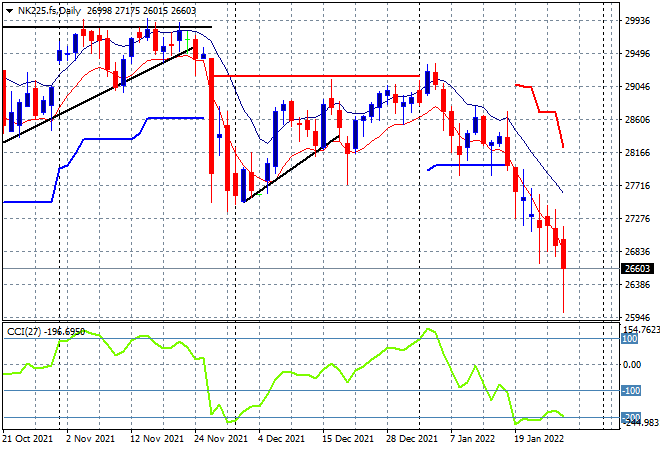
Japanese markets are taking the biggest hits, despite a weaker Yen with the Nikkei 225 closing more than 3% lower at 26170 points. Futures remain extremely uncertain here although a downtrend is quite evident from the 29000 point high as momentum readings remain extremely oversold with price action retreating to the 2021 yearly lows:
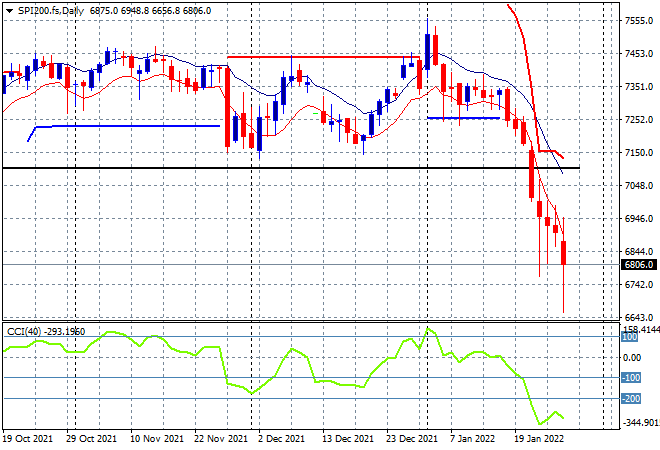
Australian stocks couldn’t escape the carnage with the ASX200 closing 1.8% lower to definitively stay below the 7000 point level, finishing at 6838 points. SPI futures are relatively stable given the inability of Wall Street to make headway yet again, while the much lower Australian dollar is giving some internal support. The daily chart was exhibiting a classic deceleration pattern that should have created more stability before yesterday’s bad session, but momentum remains extremely oversold, with high volatility not helping in determining direction:
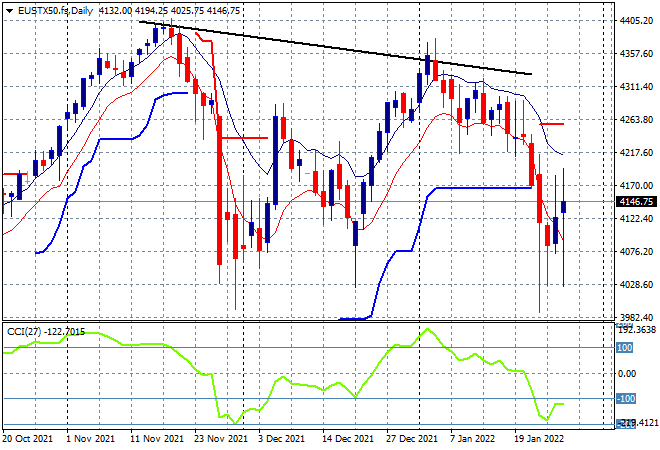
European shares continued their bounceback but the gains were more modest, with the FTSE doing better than the continent, as the Eurostoxx 50 index finished just 0.5% higher at 4184 points. Futures saw a mild pull back following the late selldown on Wall Street as confidence is still not there to properly fill this bounce just yet and we may see a repeat of the December dip and cover event, as price bounces off monthly support forming at the 4000 point level but doesn’t go anywhere for awhile:
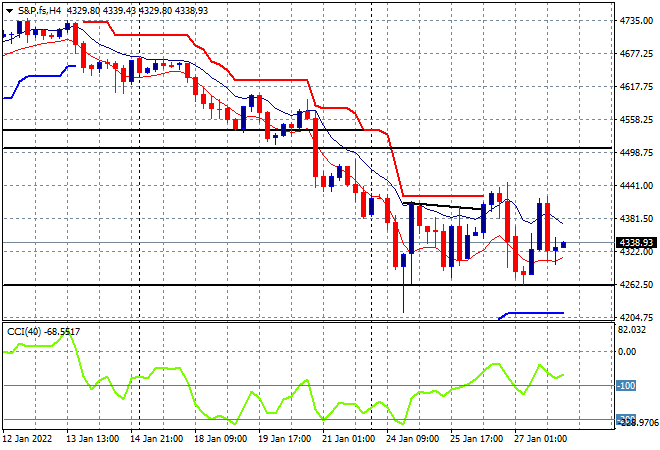
Wall Street was again up at one stage but gave it all up at the close with the NASDAQ losing the most on missed earnings reports, down 1.4% while the S&P500 finished 0.5% lower at 4326 points. The four hourly chart shows price bouncing along at key support at the 4260 point level but failing to get above overhead ATR trailing resistance and make any new session highs, always a bad signs in a downtrend, although momentum is no longer oversold, its still quite negative:
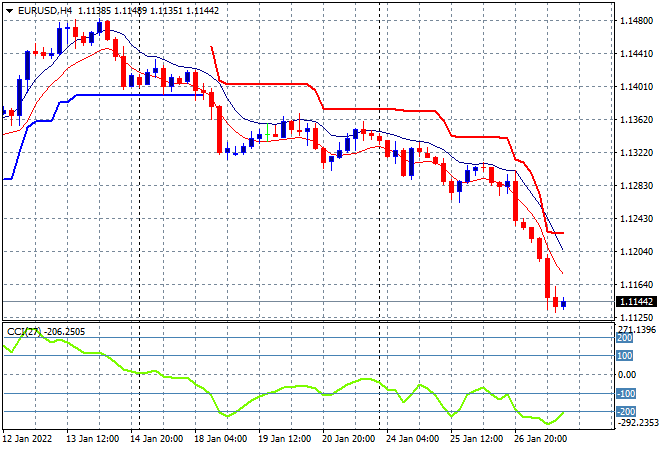
Currency markets continue to increase in volatility as the USD goes from strength to strength against everything – again. Euro is falling sharply, having been in a major downtrend for over a week prior to the Fed meeting with the union currency falling through to the 1.11 handle in a swift move. This takes out multi week support with the four hourly chart shows momentum extremely oversold and some selling exhaustion setting in here at the mid 1.11 level:
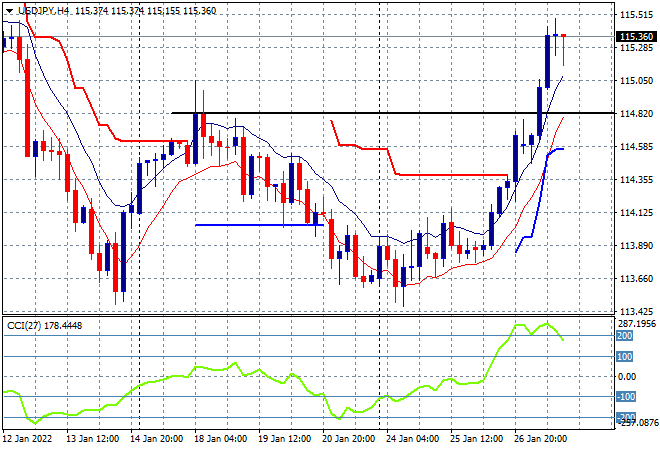
The USDJPY pair zoomed higher again in contrast, this timing shooting up through the 115 handle in another fast move that well and truly takes out the previous weekly highs. Nominally, this should be good for domestic Japanese stocks but risk markets are going uncorrelated here, and again its a case of overextension – note the latest four hourly candles – as momentum exceeds extremely overbought levels that could see a retracement back to the high moving average at the 115 handle proper:
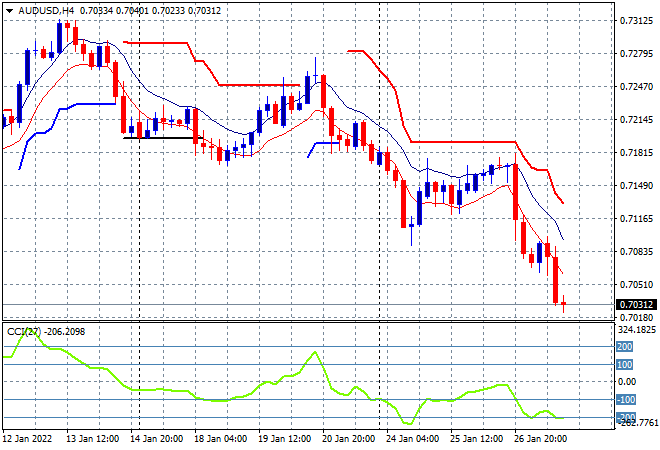
The Australian dollar remains under a lot of pressure and has slumped yet again, this time threatening the 70 handle and making a new monthly low in the process. This almost sets up the right hand shoulder of a huge head and shoulders pattern on the weekly chart that will spell doom for the RBA as it slowly wakes up to the idea of a much much lower domestic currency in the face of global inflationary pressures:
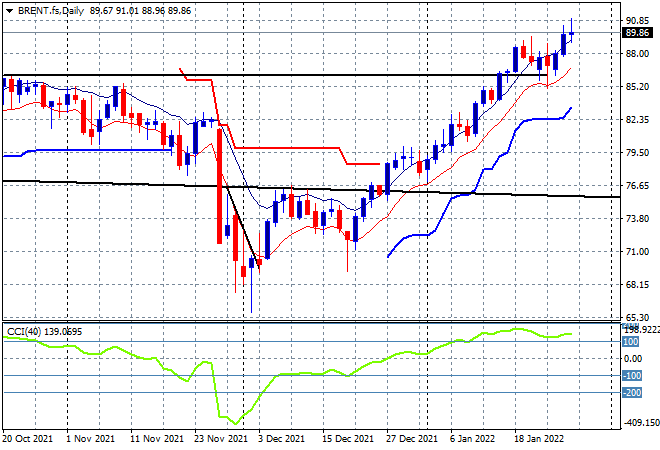
Oil markets remain strong on the trifecta of strong USD, Ukraine/Russia crisis and OPEC+ staying the course with Brent remaining just shy of the $90USD per barrel level overnight to maintain its yearly highs. Daily price action via candle analysis is again suggesting a potential top but this may well be brushed aside again quickly as momentum readings remained in overbought territory with price supported above the previous highs at the highest horizontal black line. The next target is obvious at $100USD per barrel, the support levels that held in 2010-2012 before the recent secular bear market in crude oil:
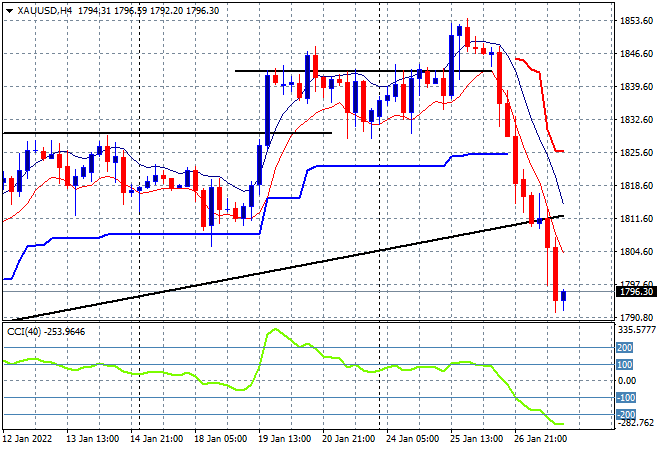
Gold is falling fast in the wake of the too strong USD, with the shiny metal pushed below the key $1800USD per ounce level overnight, shedding more than $50 since the Fed meeting and setting a course for lower levels from here on out. This takes it well below the daily trendline from the December lows where we’re likely to see a full retracement down to $1760 or so after a small amount of consolidation here due to oversold momentum:
Glossary of Acronyms and Technical Analysis Terms:
ATR: Average True Range – measures the degree of price volatility averaged over a time period
ATR Support/Resistance: a ratcheting mechanism that follows price below/above a trend, that if breached shows above average volatility
CCI: Commodity Channel Index: a momentum reading that calculates current price away from the statistical mean or “typical” price to indicate overbought (far above the mean) or oversold (far below the mean)
Low/High Moving Average: rolling mean of prices in this case, the low and high for the day/hour which creates a band around the actual price movement
FOMC: Federal Open Market Committee, monthly meeting of Federal Reserve regarding monetary policy (setting interest rates)
DOE: US Department of Energy
Uncle Point: or stop loss point, a level at which you’ve clearly been wrong on your position, so cry uncle and get out!