
A slew of disappointing economic prints saw Wall Street finish in mixed fashion again on Friday night with the USD finally reversing course. US retail sales and industrial production prints fell back which saw the bond market sell off as 10 year yields almost hit the 1.8% level again. Gold fell back alongside other risk currencies, while oil prices and other commodities leapt higher with Brent crude exceeding its 2021 high.
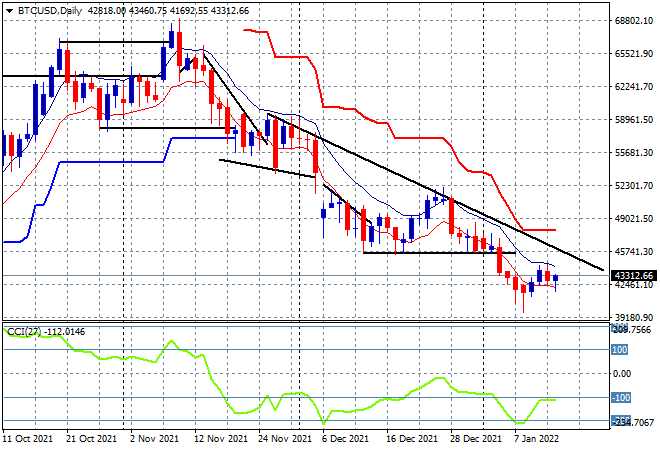
Bitcoin is struggling to make headway with yet another disappointing week as it failed to get back above the $44K level after finding a potential bottom at the $40K level. Friday night saw it pull back to the low $43’s as it remains below the dominant downtrend from the November highs as momentum remains negative:
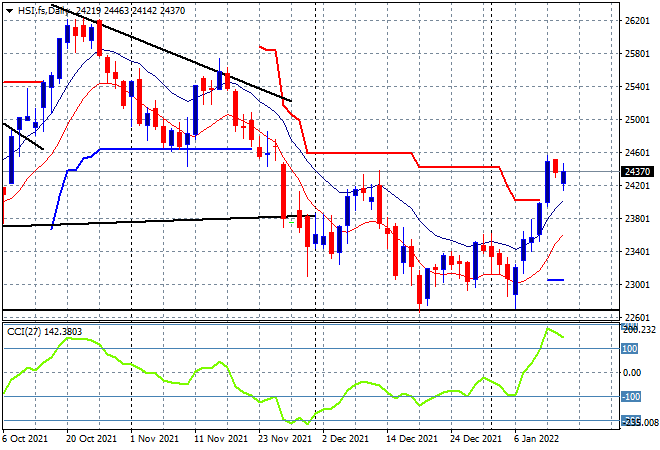
Looking at share markets in Asia from Friday’s session where mainland Chinese shares pulled back again with the Shanghai Composite down 0.9% to 3521 points while the Hang Seng Index was down nearly 1% before recovering to only fall 0.2%, closing the week out at 24383 points. The break above the 24000 point level is sticking so far, with my view to a small consolidation phase remaining likely so far as price is almost ready to clear the previous support/resistance line from early November last year:
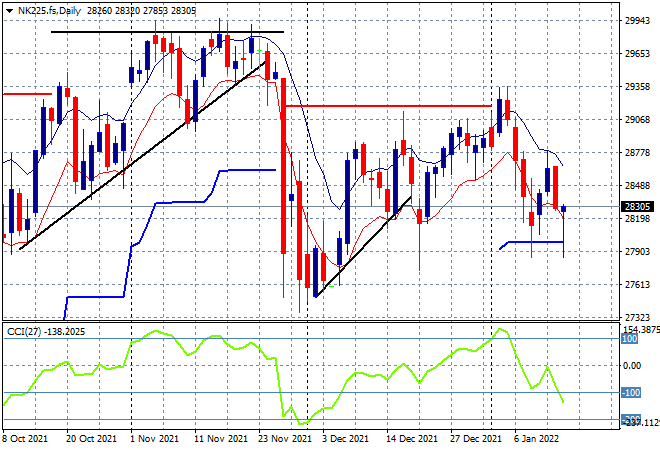
Japanese markets also sold off in response to some big Yen appreciation with the Nikkei 225 closing 1.2% lower at 28124 points. Price action is being contained here at short term resistance below the 29000 point level as the stronger Yen continues to dominate, with volatility on Wall Street not helping at all either. Futures are indicating an unsteady start to the trading week with daily momentum remaining negative as we potentially head back to the December point of control at the 28000 point level:
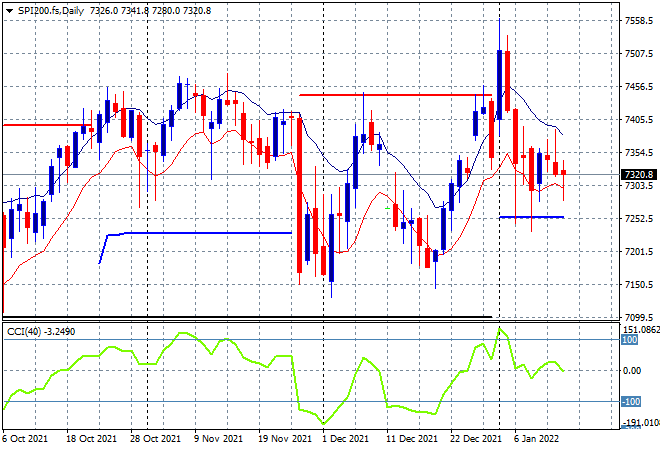
Australian stocks went down swiftly in response to the slump on Wall Street with the ASX200 closing 1.1% lower to retrace below the 7400 point level. SPI futures are up 30 points despite the mixed returns on Wall Street on Friday night. The daily chart continues to look volatile here even with support building below at the 7250 point zone, as short positions mounting to the upside but watch for a potential break above the 7400 point area to get things moving again:
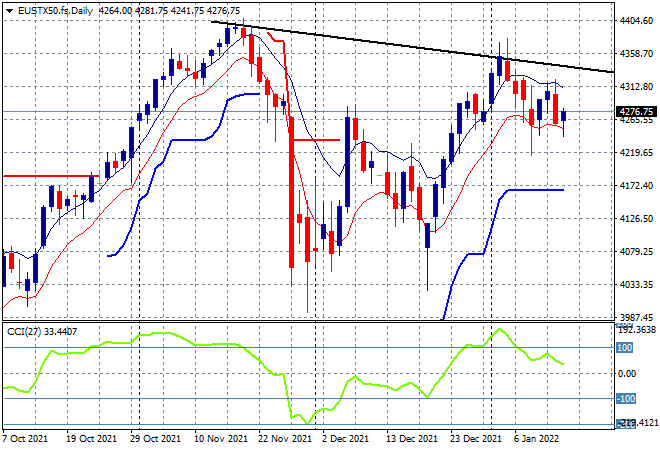
European shares all had mild selloffs to finish the week in the wake of a stronger Euro, the German DAX the biggest loser, down 0.9% to close well below the 16000 point level, while the Eurostoxx 50 index finished 1% down at 4272 points. The daily chart still shows the potential for a rollover building, with the overall stronger Euro and wobbly Wall Street moves pushing price down to support at the 4200 point area with the inability to clear the daily downtrend line at the 4350 point level:
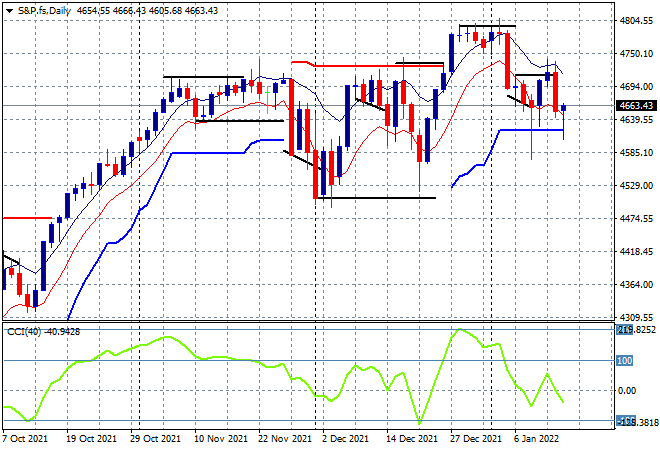
Wall Street remains unable to shake off the concern about higher inflation and the latest economic prints provided mixed clues with the NASDAQ bouncing back, up 0.6% while the S&P500 barely put in a scratch session to finish at 4662 points, unable to maintain price above the 4700 point level or the session highs of the previous week (solid black horizontal line). This is a messy daily chart with potential shoulder patterns for a bearish head and shoulders but support has been extremely firm at the 4600 point level as we head into the next round of speculation around Fed tightening. I’m watching daily ATR support to hold here:
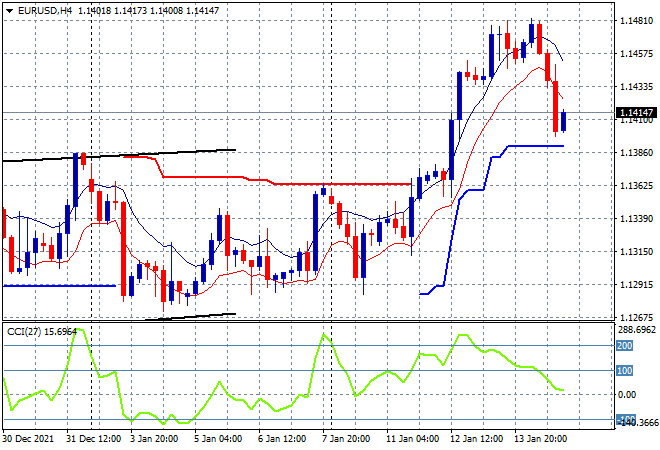
Currency markets flipped as the latest US retail sales figures saw USD unexpectedly strengthen against everything with Euro leading the charge for a reversal, as it was unable maintain its breakout position although it did finish the week just above the 1.14 handle. Resistance at the 1.1480 level had already been building before the release and despite the large move, price keeps it above the previous weekly highs with my expectations of a pullback fulfilled. The next are to watch is short term support at the 1.1380 level:
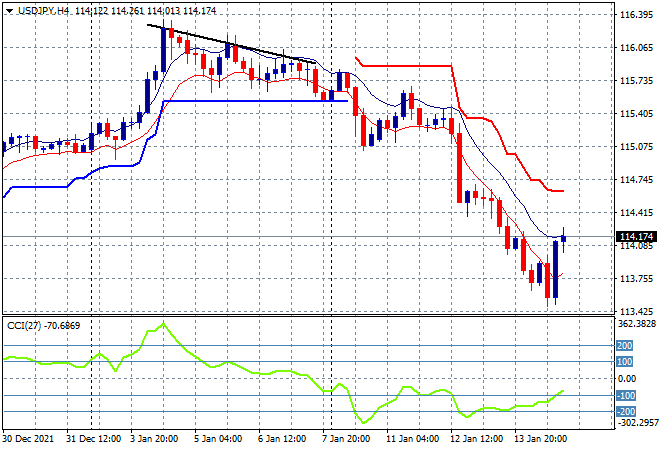
The USDJPY pair was able to eke out a very small bounceback but the overall trend remains dire here, with a slightly move back above the 114 handle still maintaining that new monthly low. This will continue to provide a very tough headwind for Japanese stocks but could be setting up for a swing trade back to trailing overhead ATR resistance at the mid 114 level, so watch for any gap higher on the open this morning:
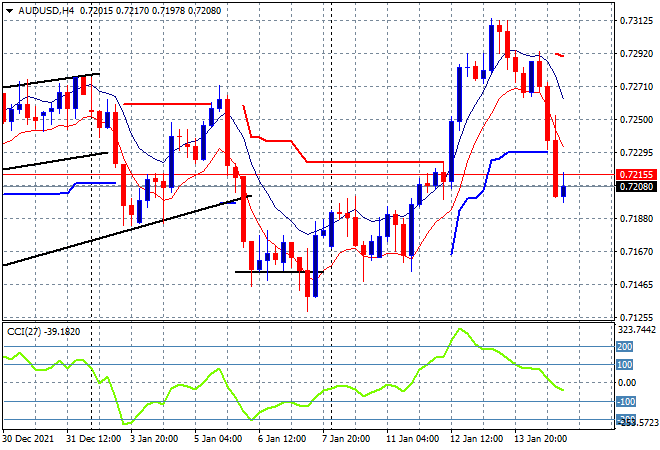
The Australian dollar was one of the biggest casaulties of the USD reversal on Friday night, losing 100 pips from its Thursday night highs to finish the week right on the 72 handle and taking away the previous attempt to make a new weekly high position. Momentum readings were nearly off the charts before this with my expectation of a pullback to the 72.70 level fulfilled, but this was a much swifter selloff that shows there’s not a lot of internal buying support for the Pacific Peso. I’m watching the the 71.50 level to come under threat next:
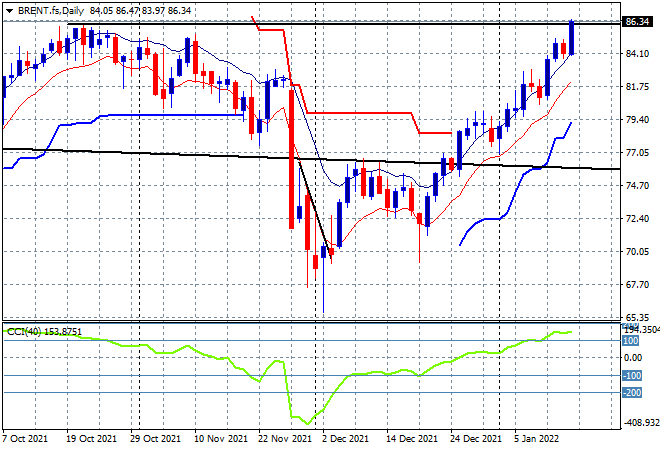
Oil markets loved the stronger USD with Brent crude surging to a new high for the year, in fact taking out the previous 2021 highs to close above the $86USD level on Friday night. Daily momentum was well into overbought territory beforehand as the fill in to reach the October highs was complete but as usual, volatility in oil markets helped push this big trend even higher. With the new highs taken out there’s potential for a move up to $90 next:
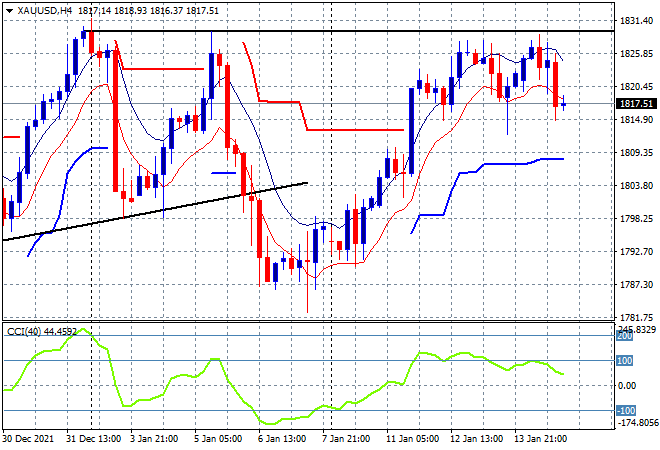
Gold is still struggling to get back to its former highs after clearing the key $1800USD per ounce level in previous sessions with Friday night seeing a small swing down to the $1817 level on USD strength. The previous session highs are obviously still showing a lot of resistance here on the four hourly chart with an inability to clear the $1830 level which is worrisome. Watch out of another potential “unexpected” rollover to materialise:
Glossary of Acronyms and Technical Analysis Terms:
ATR: Average True Range – measures the degree of price volatility averaged over a time period
ATR Support/Resistance: a ratcheting mechanism that follows price below/above a trend, that if breached shows above average volatility
CCI: Commodity Channel Index: a momentum reading that calculates current price away from the statistical mean or “typical” price to indicate overbought (far above the mean) or oversold (far below the mean)
Low/High Moving Average: rolling mean of prices in this case, the low and high for the day/hour which creates a band around the actual price movement
FOMC: Federal Open Market Committee, monthly meeting of Federal Reserve regarding monetary policy (setting interest rates)
DOE: US Department of Energy
Uncle Point: or stop loss point, a level at which you’ve clearly been wrong on your position, so cry uncle and get out!