
Not a good start for the trading year for Wall Street with the release of the latest US unemployment print which was all over the place – not even 200K jobs created, far short of the 400K expected – but the actual rate fell and wage growth increased. This sent the bond market in a tizzy, sending 10 year Treasuries up near the 1.8% level for new yearly highs while intrest rate futures more or less locked in a March lift by the Fed. Wall Street slumped on the print while risk currencies lifted against USD, especially Euro. Gold almost climbed back above the key $1800USD per ounce level while oil prices remained buoyant. Its going to be an interesting start to the trading week!
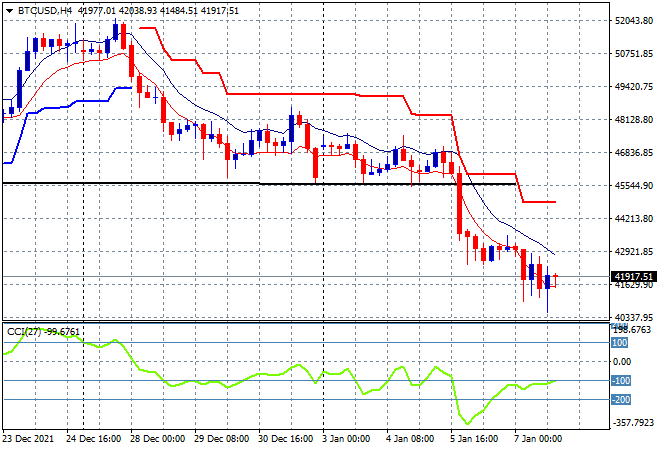
Bitcoin broke down mid last week below its previous daily lows at the $46K level, and suffered throughout Friday night with a finish at the $42K level, possibly finding a potential but weak bottom. There’s still daylight below to the next major support levels at $30K, with minor support at the September 2021 lows at $40K possibly coming up as the next short term area of support, but there’s certainly no upside potential at the moment:
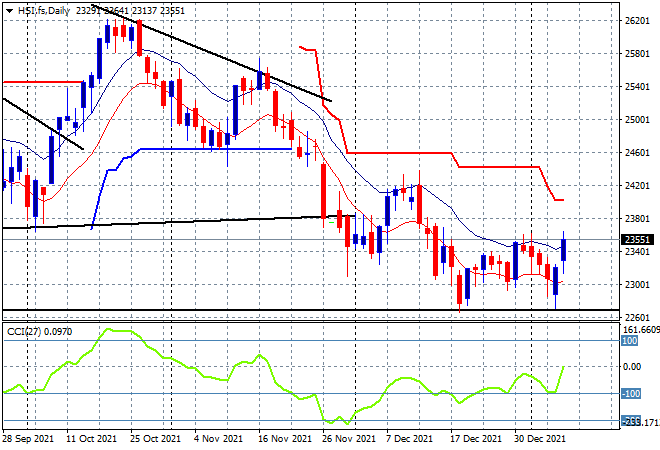
Looking at share markets in Asia from Friday where mainland Chinese shares were building a little but then sold off later in the session with the Shanghai Composite finishing 0.2% lower at 3579 points while the Hang Seng Index put in a very strong bounceback, up over 1.8% to punch through the 23000 point level, closing at 23493 points. Price is liking the 23000 point level here where multi-month support lived previously, with increased signs of support building but this requires a substantial break above the 24000 point level to get moving higher:
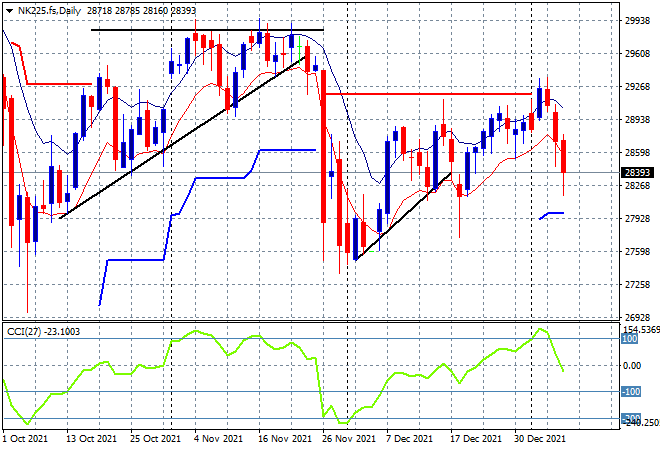
Japanese markets did not like the overall mood with the Nikkei 225 closing dead flat at 28478 points with futures not looking good to start the week. Price action had tried to push through overhead resistance at the 29000 point level with momentum picking up strongly but correlation with other risk markets and the Friday night inversion in Yen proving too much for the market. Momentum has reverted to negative readings as we head back to the December point of control at the 28000 point level:
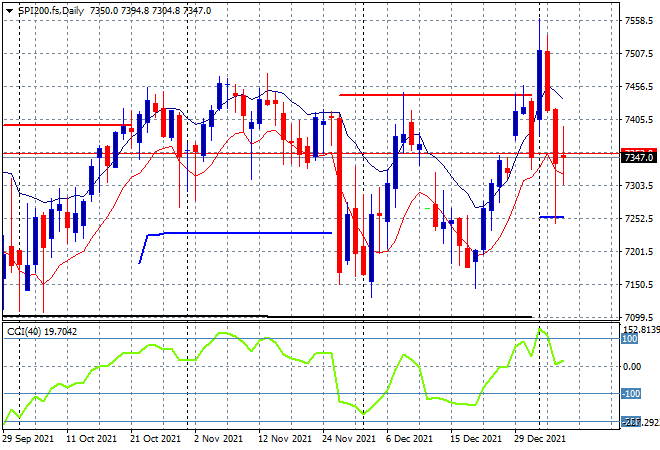
Australian stocks bounced back from their bad selloff, with the ASX200 closing 1.3% higher at 7453 points. SPI futures are showing a decline in line with Wall Street on Friday night so it could be a turbulent start for locals as the daily chart looks volatile with this false breakout above the 7500 point level possibly showing a return to previous weekly support at the 7100 point level if the Australian dollar in particular firms too strongly post the NFP print:
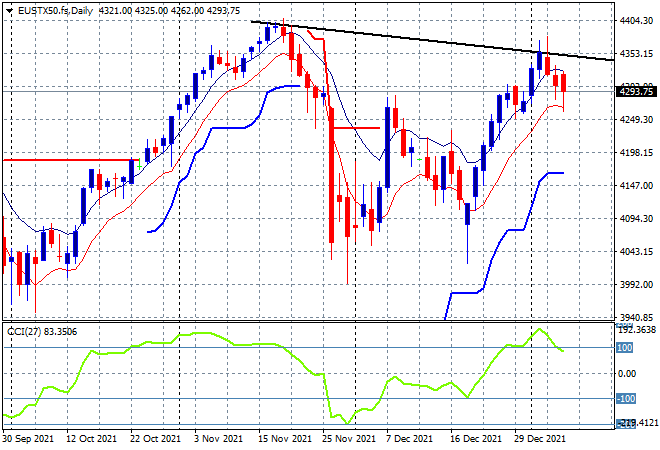
European shares had a wobbly finish to the end of the trading week with only the FTSE putting on any gains, while the German DAX closed 0.6% lower and the Eurostoxx 50 index finished off 0.4% to the 4305 point level. The daily chart shows how this Santa rally has not yet passed the November highs and has the potential to rollover, particularly with a much stronger Euro that is likely to dominate in the short term. Watch for any signs of breaking support at the 4200 point area next:
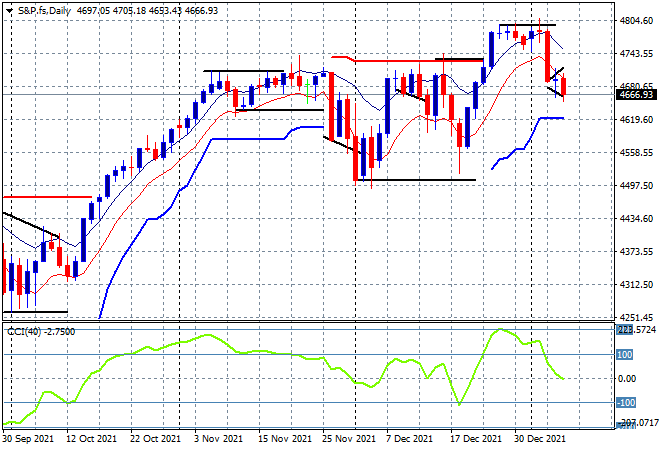
Wall Street tried to catch its breath in the wake of the recent selloff in tech stocks but couldn’t get over the internal strength of the NFP print with the NASDAQ closing another 1% lower, while the S&P500 fell about half that, again finishing below the 4700 point level. The daily chart shows how the move above the 4800 point level just doesn’t have the momentum or price potential it needs with short term volatility as we head into the next Fed meeting. Watch the 4600 point level which must remain firm or another drop to the 4500 November lows is on the cards swiftly:
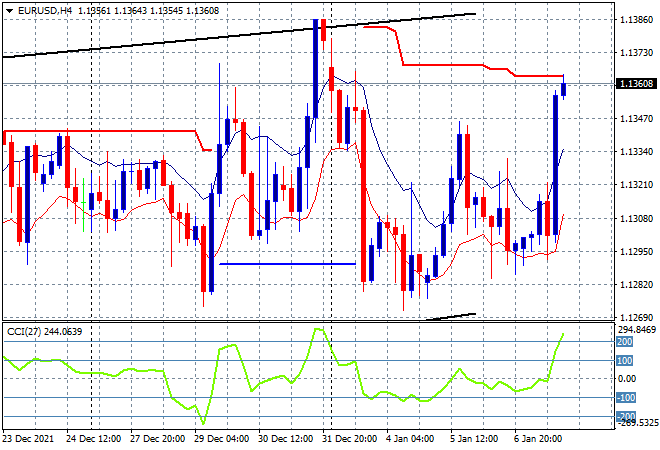
Currency markets had a big inversion on Friday night following the NFP print with the recently strong USD post the Fed minutes pushed back hard against most of the risk currencies. The beleaguered Euro was able to almost get back to its previous weekly highs at the 1.1360 level in a swift move, having built a modicum of support at the 1.13 handle in the lead up to the unemployment print. The bearish rising flag pattern remains quite evident on the daily chart but the four hourly chart is broadcasting a bit more strength here with a short term push to the 1.14 handle likely:
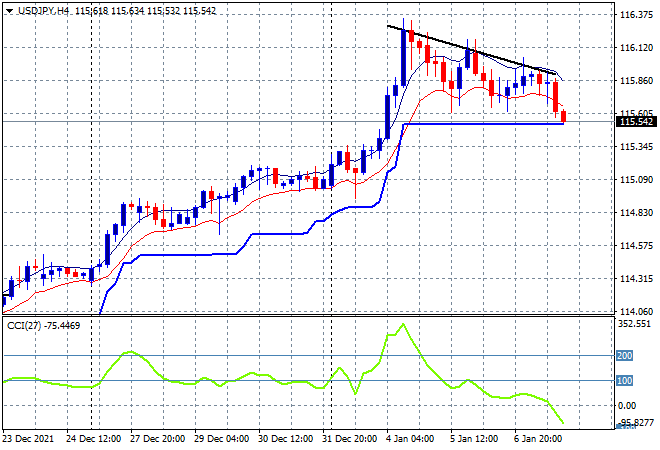
The USDJPY pair however had a very calm breakdown, falling to trailing ATR four hourly support at the mid 115 level in the wake of the US unemployment release. This pulls back almost all of the previous move that from last week that created a new five year high above the 116 handle with the small downtrend line caused by a series of lower highs now proving overhead short term resistance that needs to be broken through to re-engage this trend, let alone support that has to stabilise here:
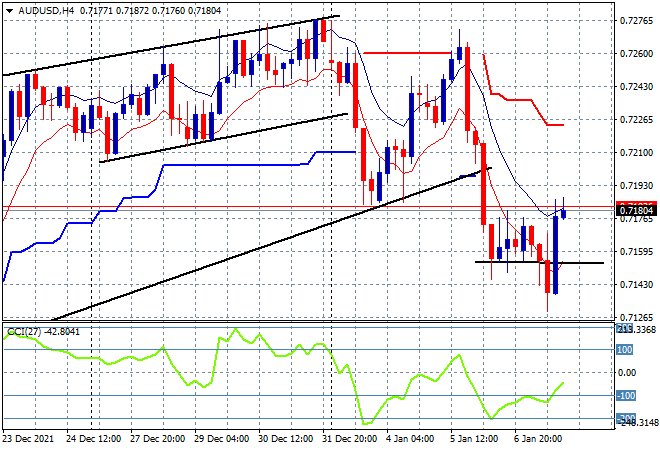
The Australian dollar was able to bounce back a little, but relatively speaking it was weak, still below the 72 handle and remaining at a three week low. Despite strong moves in commodity prices, particularly iron ore, and the weaker USD, there’s not much support being provided here so I still contend we will see a move down to the 71 handle or lower. Watch for any upside break above high moving average here for a potential swing rally back up to trailing resistance at the low 72s however:
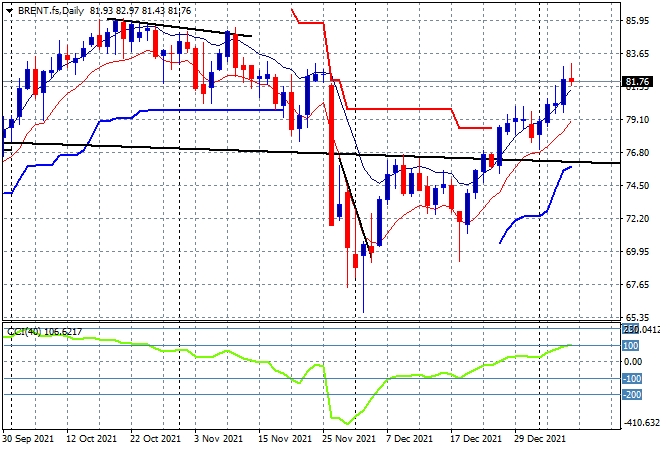
Oil price volatility is pulling back slightly despite the certainty around the OPEC+ decisions with Brent crude finishing unchanged at just below the $82USD level on Friday night. After clearing its previous weekly highs the daily chart is showing a breakout building here, but the daily candles are showing some hesitation to the upside that could be signs of resistance building at the $82-83 level as daily momentum is reluctant to move into overbought territory:
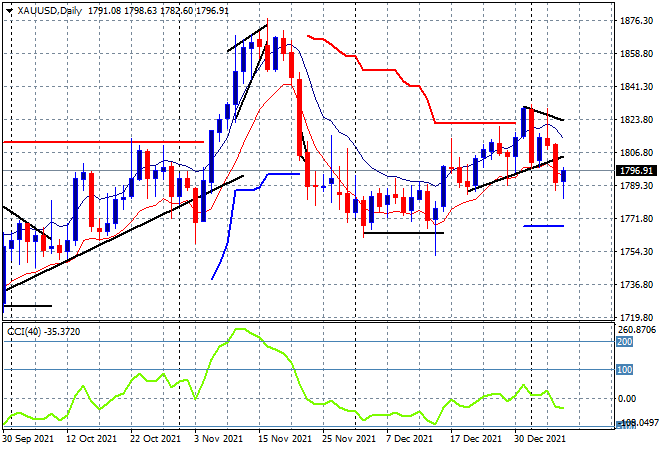
Gold is struggling to get back on track and even after a pullback in USD strength it was unable to get back above the $1800USD per ounce level on Friday night, with price action still below the recent uptrend line that broke post the hawkish Fed minutest. Price action is still signalling a return to the December 2021 lows, spelling the end of this reflation stage:
Glossary of Acronyms and Technical Analysis Terms:
ATR: Average True Range – measures the degree of price volatility averaged over a time period
ATR Support/Resistance: a ratcheting mechanism that follows price below/above a trend, that if breached shows above average volatility
CCI: Commodity Channel Index: a momentum reading that calculates current price away from the statistical mean or “typical” price to indicate overbought (far above the mean) or oversold (far below the mean)
Low/High Moving Average: rolling mean of prices in this case, the low and high for the day/hour which creates a band around the actual price movement
FOMC: Federal Open Market Committee, monthly meeting of Federal Reserve regarding monetary policy (setting interest rates)
DOE: US Department of Energy
Uncle Point: or stop loss point, a level at which you’ve clearly been wrong on your position, so cry uncle and get out!