
Risk markets continued the little Santa Claus rally overnight with solid returns on Wall Street and European markets but again, very low trading volumes maybe masking the solidity of these returns as we head into the end of the trading year. The final GDP prints for the EU and US came in a little higher than expected, giving a boost to risk taking with risk currencies launching higher versus USD, with commodity markets also seeing a strong bid with Brent and WTI crude up more than 2% while gold finally pushed through the $1800USD per ounce level.
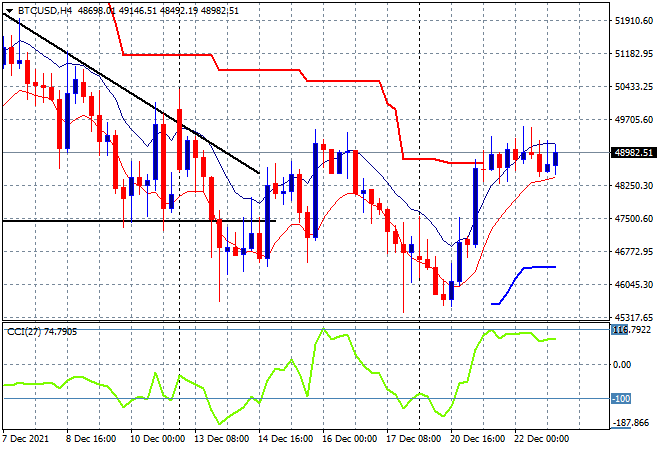
Bitcoin is hovering just below the $49K level, unable to move higher after its mid week bounce as short term momentum remains unable to cross into the overbought zone. Price action is still setting lower highs so don’t get too excited just yet as the technical picture still remains grim for crypto with the next support levels are quite far away at the September lows around $43K, with daylight below to $30K next:
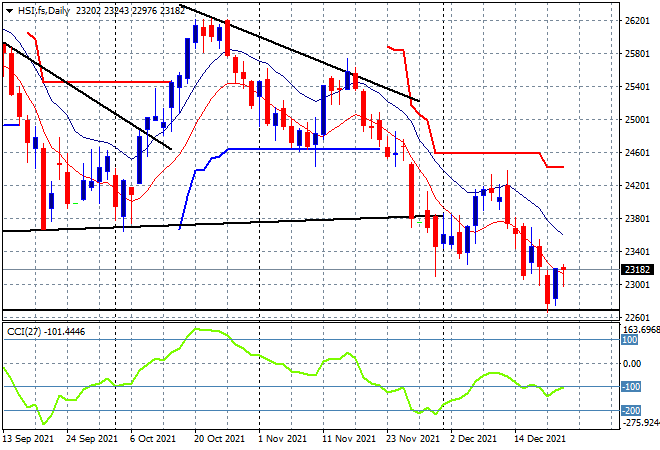
Looking at share markets in Asia from yesterday’s session, where mainland Chinese shares were flat going into the end of the session, with the Shanghai Composite losing a handful of points to be at 3621 points while the Hang Seng Index gained more ground, lifting 0.6% to 23102 points. This keeps price around the 23000 point level where multi-month support lives, but remaining here at the 2020 lows (lower black line) still the potential to start a new bear market if it doesn’t make a substantial new daily high soon above the high moving average line:
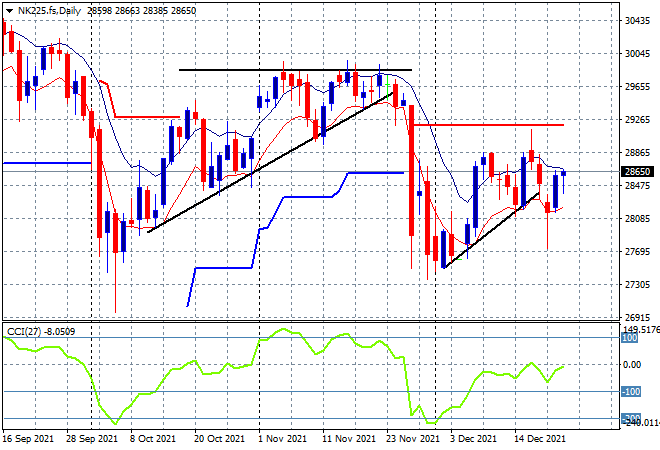
Japanese markets also danced with a scratch session, the Nikkei 225 closing almost where it started at the 28562 point level. Price action could get back to overhead resistance at the 29000 point level that has failed to clear in recent weeks but momentum remains negative on the daily charts so be wary of a potential bull trap that could see price revert back to the 27000 point proper soon:
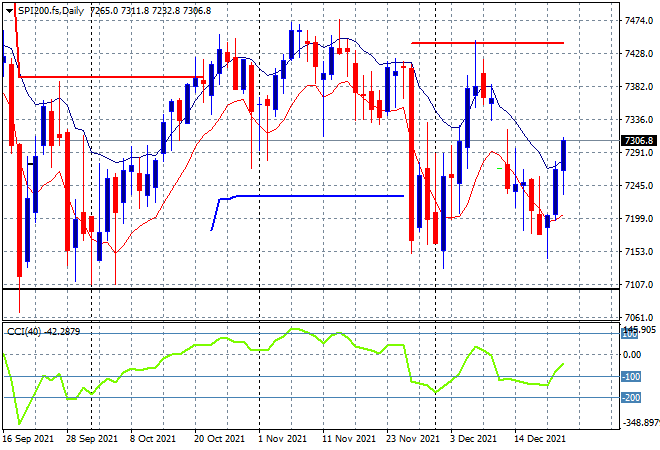
Australian stocks remained steady, with the ASX200 closing 0.2% higher at 7364 points. SPI futures are up more than 0.5% on the rise on Wall Street so we could see a push up towards resistance again at the 7400 point level, with a potential Santa rally building as traders start to leave their desks and head to a COVID testing station….The market seems anchored more near the November lows but the technical setup is continuing to show a proper swing play though:
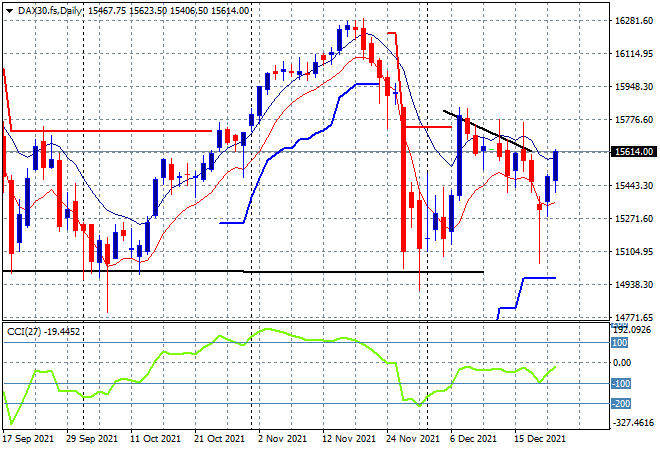
European markets all had solid sessions to continue their bounceback with the German DAX up nearly 1% to close at 15593 points. The higher Euro hasn’t provided a headwind so this looks good nominally, but daily momentum remains negative and resistance overhead is still very strong so this could be short lived until liquidity dries up completely going into Xmas:
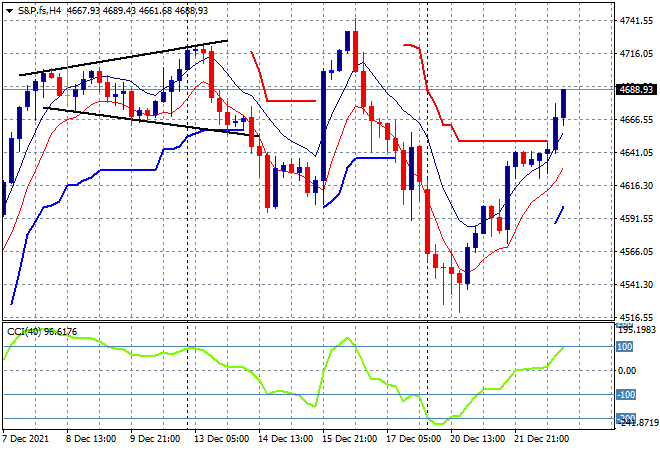
Wall Street did about the same with the BTFD team lifting the NASDAQ and S&P500 more than 1% higher, the latter closing at 4696 points. The four hourly chart shows a lot of intrasession volatility and last night was no exception with the shorts completely abandoning their positions it seems clearing trailing ATR resistance and pushing price back towards the midweek point of control around the 4650 point level. The market is not that far off its highs here and all traders will be watching for signals to see if price can get back above 4700 points:
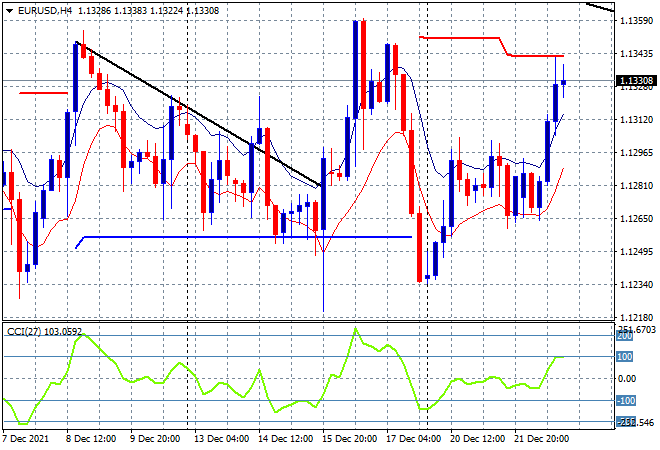
Currency market volatility is still fairly high with risk currencies getting stronger against USD with Euro putting on a strong surge alongside Pound Sterling on the final UK 3Q GDP print with th e four hourly chart showing a push up through the 1.13 handle overnight. This takes price back to the previous weekly highs, but not above them as momentum remains positive but not yet overbought with intrasession support seeming to slip away here at these levels, so this move may not be sustainable, just like the last two:
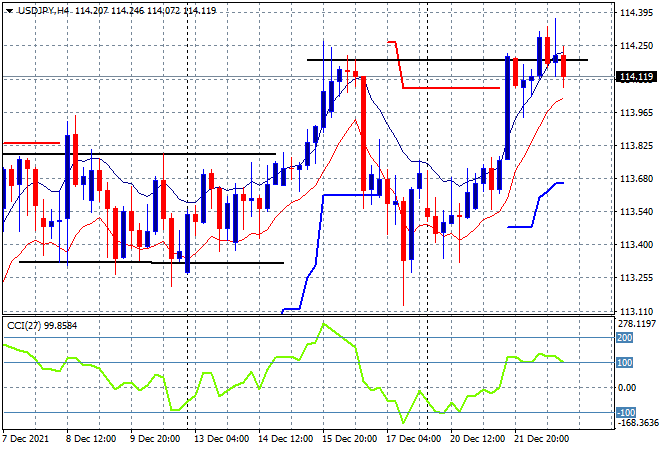
The USDJPY pair remained in a tight trading range overnight, unable to breakout further above the 114 level as it too continues to match previous weekly highs despite the surge in risk sentiment. The four hourly chart remains promising again with price hovering at or slightly above the previous weekly high but momentum is starting to rollover from a meek overbought level with resistance building here:
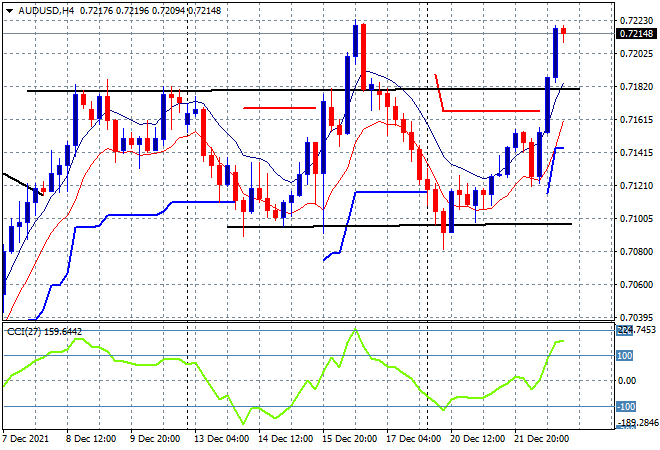
The Australian dollar followed Euro and Sterling higher albeit with more relative performance, pipping through the 72 handle to almost make a new weekly high in the process. My contention of a swing up to the 72 level on sentiment going into the low liquidity period of the year is fulfilled here but could extend further if price head above the 72.20 level again in the short term. But watch out for tonight’s US Core PCE index print that might return some strength to the USD:
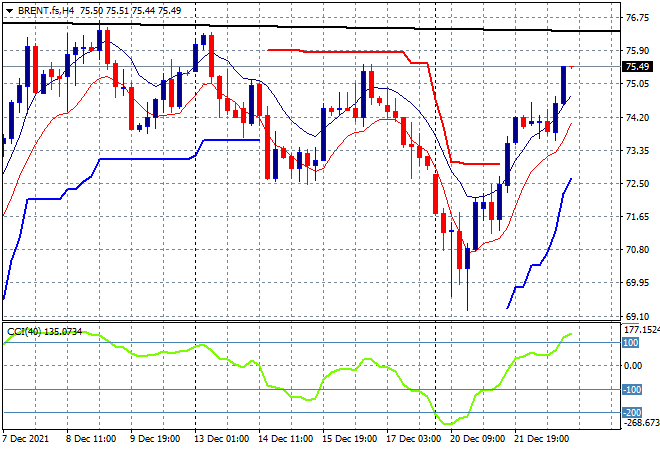
Oil prices remain volatile but to the upside again with Brent crude lifting 2% to get back above the $75USD level overnight. Another market that looks promising but has yet to clear previous weekly highs with the four hourly chart showing a nicely filled bounce but is still not near the previous highs around the $76 level. Longer term charts still spell trouble ahead for Brent so be cautious until the $76-77 zone is cleared:
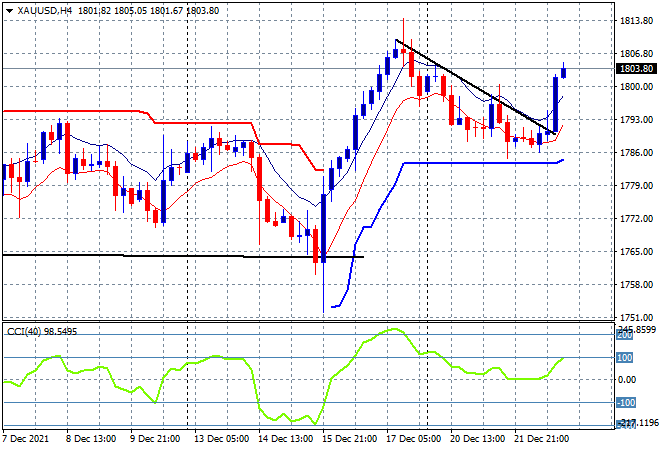
Gold is providing a small Xmas present to the bugs with a push above the $1800USD per ounce level overnight after failing all week to get back on track on last Friday’s similar push. The four hourly chart shows a classic breakout above the descending triangle pattern here with sentiment pushing the shiny metal higher. But will it be enough? Momentum is not yet overbought and price hasn’t cleared the previous high from last week so stay tuned:
Glossary of Acronyms and Technical Analysis Terms:
ATR: Average True Range – measures the degree of price volatility averaged over a time period
ATR Support/Resistance: a ratcheting mechanism that follows price below/above a trend, that if breached shows above average volatility
CCI: Commodity Channel Index: a momentum reading that calculates current price away from the statistical mean or “typical” price to indicate overbought (far above the mean) or oversold (far below the mean)
Low/High Moving Average: rolling mean of prices in this case, the low and high for the day/hour which creates a band around the actual price movement
FOMC: Federal Open Market Committee, monthly meeting of Federal Reserve regarding monetary policy (setting interest rates)
DOE: US Department of Energy
Uncle Point: or stop loss point, a level at which you’ve clearly been wrong on your position, so cry uncle and get out!