
The hawks are circling on Wall Street with yet another selloff overnight, the fifth in a row for European equities as risk markets anticipate the forthcoming FOMC meeting. The bond market actually slipped a little although the 10 year Treasury yield only lifting slightly, up to 1.47% level while the USD continued to firm against everything, especially Euro and other risk currencies in anticipation of a hawkish Fed. Commodity markets remain under stress too with oil prices falling nearly 2%, gold off by more than 1% while copper was down just over half a percent.
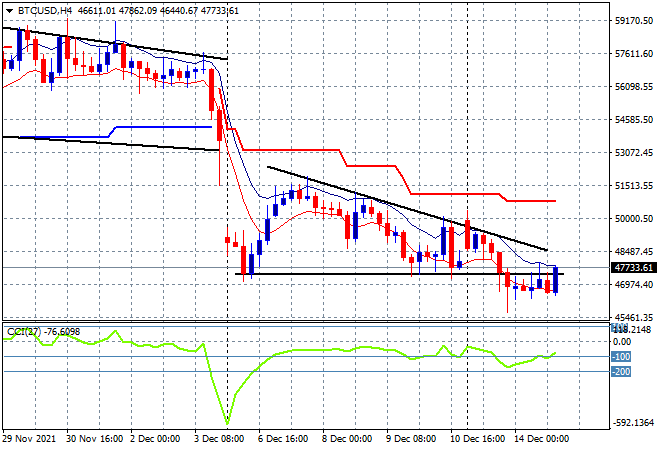
Bitcoin continued to deflate further overnight, although it had a minor rally earlier this morning, as the failure to get out of last week’s starting slump puts continued pressure on all crypto currencies. The four hourly chart shows price hovering below those slump lows at the $47K level with the next support levels quite far away at the September lows around $43K, with daylight below to $30K next, unless a rabbit can be pulled out here somehow:
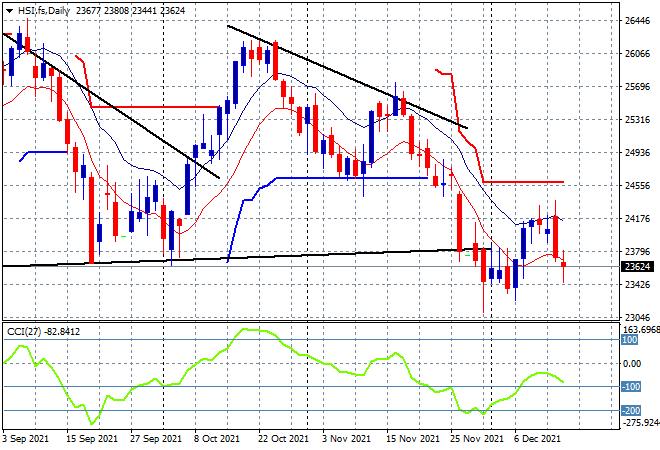
Looking at share markets in Asia from yesterday’s session, where mainland Chinese shares put in a weak session given the news of more COVID breakouts with the Shanghai Composite down more than 0.5% to 3662 points while the Hang Seng Index is down more than 1.3% to be well below the 24000 point level at 23635 points. This dead cat bounce is rolling over nicely, as daily momentum never got to a positive setting, and price action overall remaining in a long term downtrend channel with heavy resistance overhead at the 24500 point level. Watch for a further retracement below the recent daily lows to finalise this move:
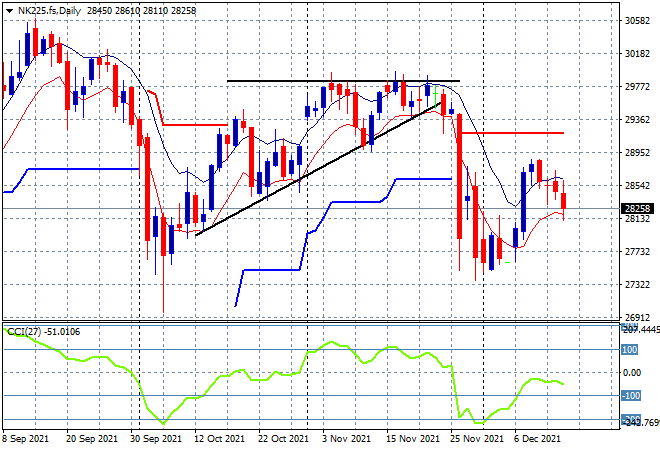
Japanese markets also took steps back despite some BOJ cash injections with the Nikkei 225 closing 0.8% lower at 28432 points. Futures are indicating more downside given the volatility overnight, with the potential to cross below the 28000 point level at the low moving average line, with momentum about to go into negative oversold territory:
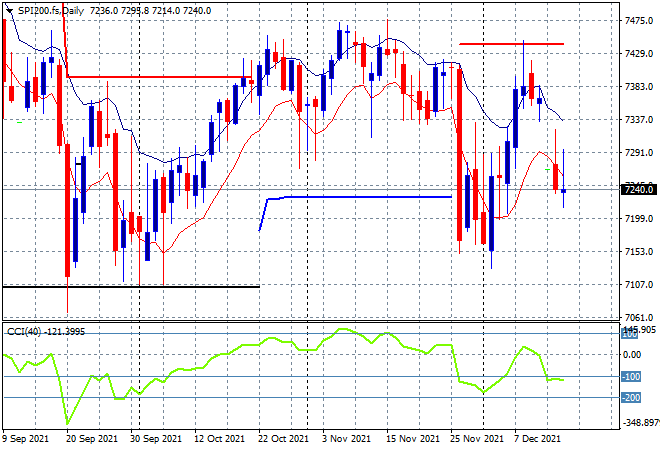
Australian stocks had the best result relatively speaking with the ASX200 putting in a scratch session losing a handful of points, closing at 7378 but obviously still unable to get back above the 7400 point level, which is turning into firm resistance. SPI futures are down more another 40 points or 0.5% so like the previous session indicator, but this could be absorbed due to the lower Australian dollar. However, resistance is turning heavy at the previous highs around the 7400 point level, continuing to weigh on sentiment as the daily chart is just not broadcasting any upside potential here for a Santa rally:
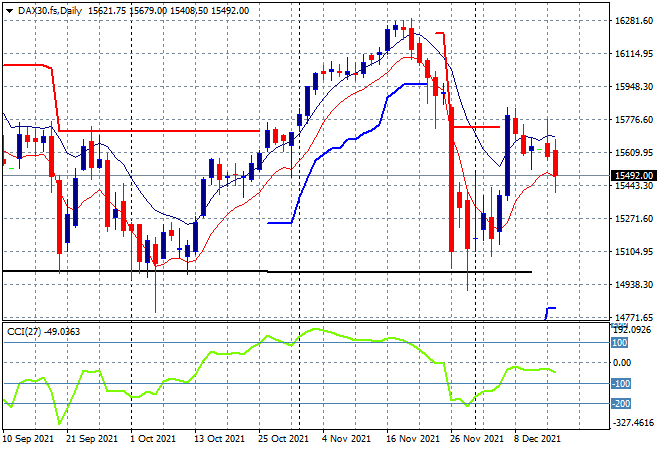
European markets continued to stall with more losses across the continent, this time the German DAX played catchup by finishing 1% lower at 15453 points. This is turning into a proper dead cat bounce just like other markets that are unable to turn daily momentum into a true positive setting, with the DAX continually unable to close out above the trailing ATR resistance level. Watch the low moving average here which must firm as short term support, but looks like breaking below the 15400 point level:
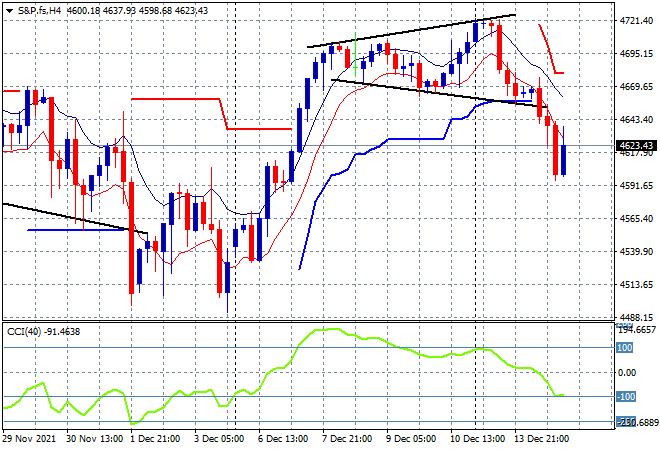
Wall Street slumped across the board, although a selloff in big tech stocks on the NASDAQ led the way again, falling more than 1% while the S&P500 retraced 0.7% lower to close at 4632 points. The four hourly chart shows ATR support at the 4660 level broken through after that megaphone pattern was formed, but momentum is not yet completely oversold so we could see some support forming at the 4600 point level:
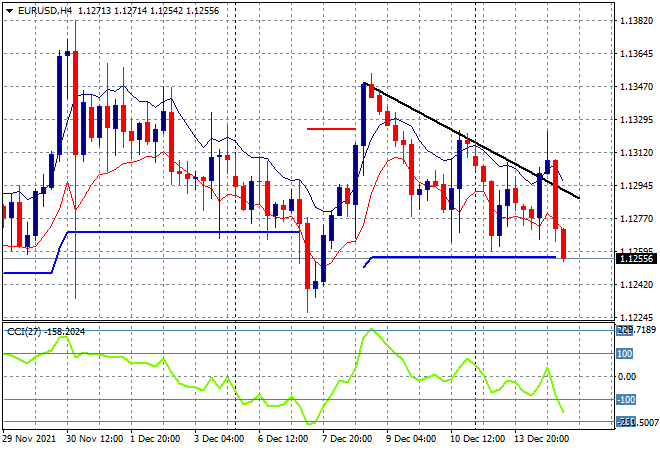
Currency market volatility remains relatively high but obviously in USD favour with Euro trying vainly to get out of its downtrend before smacked back down again almost for a new weekly low at support at the 1.1250 level. This level has held more or less for two weeks after two failed breakouts but as I mentioned yesterday, don’t confuse another breakout as real until at least the 1.13 level is cleared, with more downside potential here building as the FOMC meeting approaches:
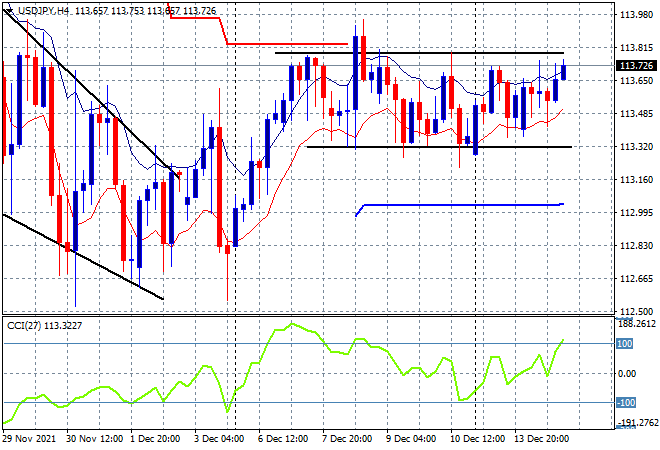
The USDJPY pair pushed slightly higher overnight, lifting above the mid 113 level but still within the rectangle pattern on the four hourly chart, containing last week’s intrasession price high just shy of the 114 handle. Momentum readings are picking up as price approaches overhead resistance going into the FOMC meeting, but it must be noted that there is a probable downturn here in line with longer term charts:
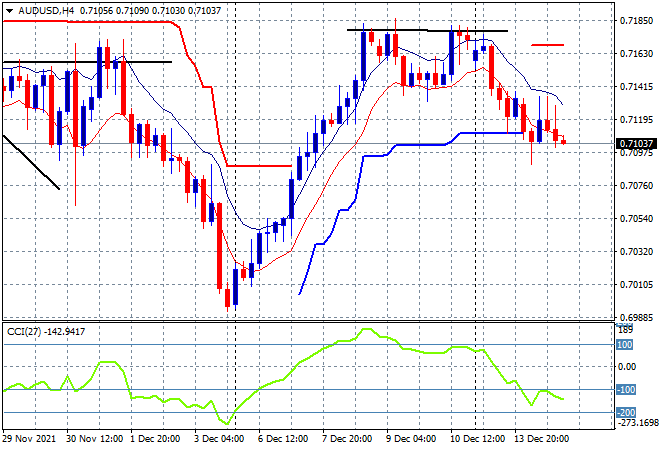
The Australian dollar was pushed solidly down again overnight after its failed breakout at the start of the week was reversed sharply, almost breaking below the 71 handle in the process. However, support seems firm there despite the obvious intrasession selling with the 71 level the area to watch when the Fed hands down its meeting:
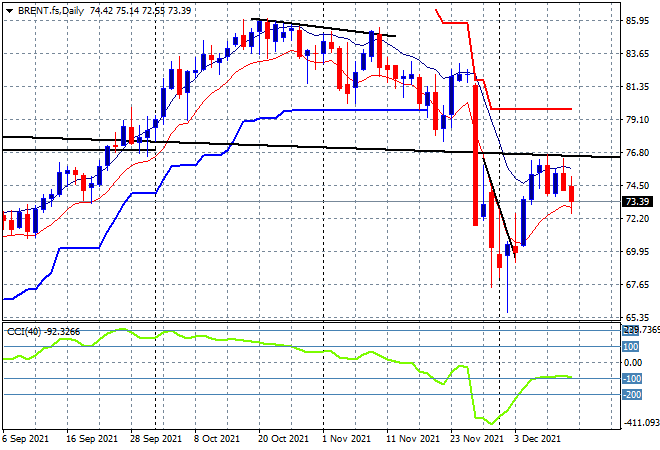
Oil prices are failing to bounce back properly from their recent setup with both WTI and Brent crude falling nearly 1.5% lower overnight, the latter retracing below the $74USD level for a near rollover. The former monthly resistance level at $77 was the target to reach in this bounceback, but this has turned into a dead cat bounce as daily momentum inverts and price moves down towards the psychologically important $70 level:
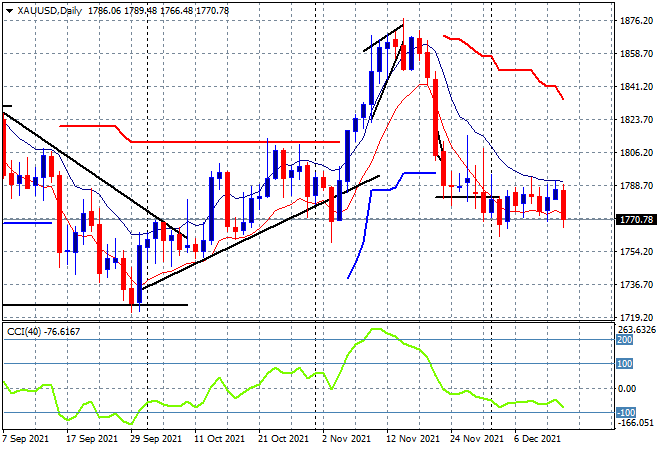
Gold returned to its previous daily lows overnight, after recently eking out small daily gains, pushing right through short term support at the $1780USD per ounce level, to close at $1770, almost matching the previous terminal low. Short term momentum had been flat at best, not going lower but the failure to punch through overhead resistance and create a new significant daily high has weighed on sentiment too much here. Failing to get above the $1800 level will mean more lows coming up:
Glossary of Acronyms and Technical Analysis Terms:
ATR: Average True Range – measures the degree of price volatility averaged over a time period
ATR Support/Resistance: a ratcheting mechanism that follows price below/above a trend, that if breached shows above average volatility
CCI: Commodity Channel Index: a momentum reading that calculates current price away from the statistical mean or “typical” price to indicate overbought (far above the mean) or oversold (far below the mean)
Low/High Moving Average: rolling mean of prices in this case, the low and high for the day/hour which creates a band around the actual price movement
FOMC: Federal Open Market Committee, monthly meeting of Federal Reserve regarding monetary policy (setting interest rates)
DOE: US Department of Energy
Uncle Point: or stop loss point, a level at which you’ve clearly been wrong on your position, so cry uncle and get out!