
A forty year surge in US inflation sent markets in a spin on Friday night with most risk markets pulling back while Wall Street just kept launching higher despite clear signals that the Fed is going to have to put an end to the party sooner rather than later. pulling back from its bounceback rally. The bond market is firming, with the 10 year Treasury yield pulling back below the 1.5% level while the USD is regaining strength against Euro and other risk currencies. Commodity markets are also consolidating with oil prices pulling back 1% while copper fell 1.5% and gold is going nowhere, falling another 0.5% to make a new weekly low.
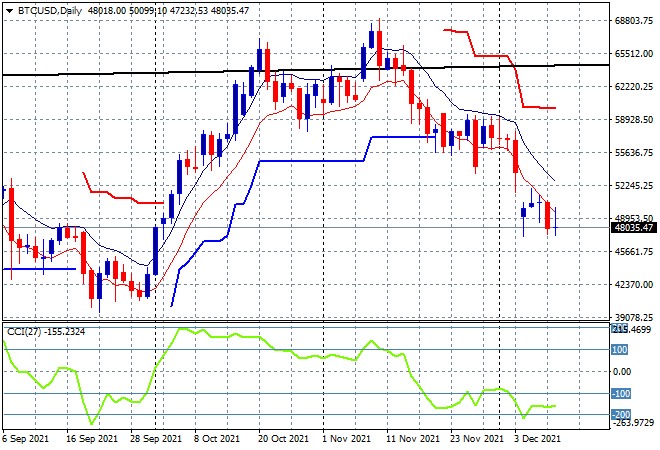
Bitcoin failed to get out of its major slump on Friday night, finishing at a new weekly low at the $48K level following a big crash in crypto currencies the previous week. The daily chart shows a return below that gap low after failing to put in a proper bounceback with the next support levels quite far away at the September lows around $43K, with daylight below to $30K next:
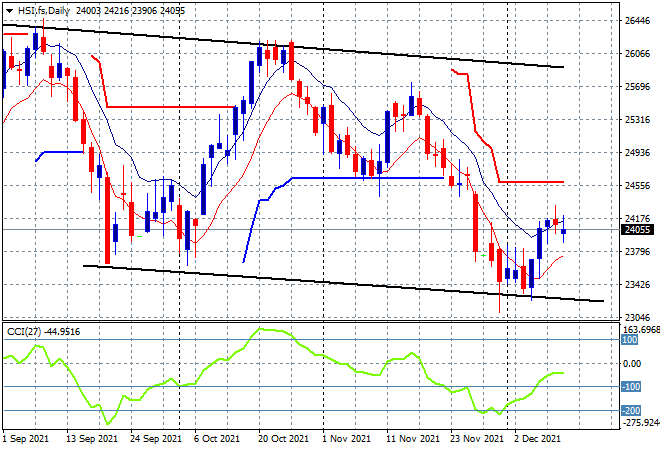
Looking at share markets in Asia from Friday’s session, where mainland Chinese shares put in a soft session with the Shanghai Composite losing a little more than 0.2% to finish at 3666 points while the Hang Seng Index is taking back its previous gains to fall 1% to finish the week back below the 24000 point level. This market just can’t get moving as this dead cat bounce comes to fruition, with daily momentum never getting to a positive setting, as price action overall remains in a long term downtrend channel with heavy resistance overhead at the 24500 point level:
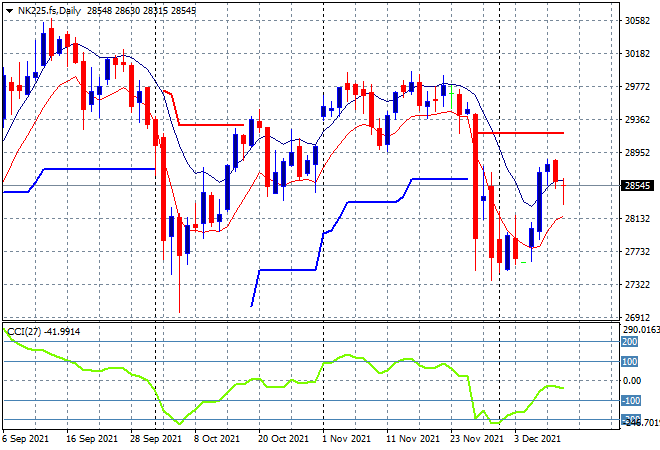
Japanese markets continued their pullback with the Nikkei 225 also closing 1% lower at 28437 points. Futures are mixed at best as the lack of a lower Yen may prove too much for this relatively weak market to push through. While there is some potential for this move to continue up towards former support, now resistance at the 29000 point level, daily momentum is not even positive yet, let alone overbought, so remain cautious:
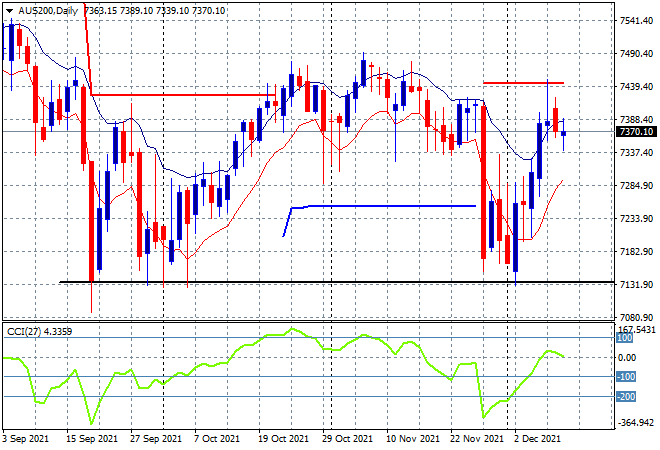
Australian stocks followed the Japanese lead, but managed to shore up the losses at the close, with the ASX200 retracing just over 0.4% to remain solidly below the 7400 point level at 7353 points. SPI futures are up about 10 points but with heavy resistance at the previous highs around the 7400 point level and the still strong Aussie dollar weighing on sentiment, it will be hard for any Santa rally to come out of the blue here and push prices higher:
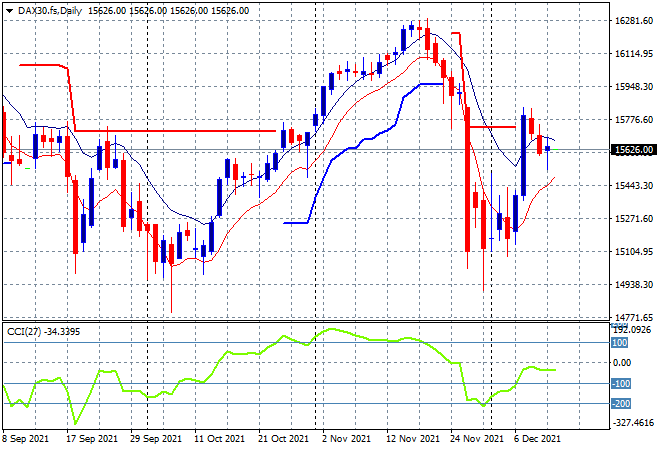
European markets continued to stall with various setbacks across the continent, with the German DAX the best off, only finishing 0.1% lower at 15623 points. This pullback is turning into a proper dead cat bounce with the inability of daily momentum to cross to a positive setting, nor has price closed out above the trailing ATR resistance level. Another close above the 15700 point level is still required to keep this bounce alive:
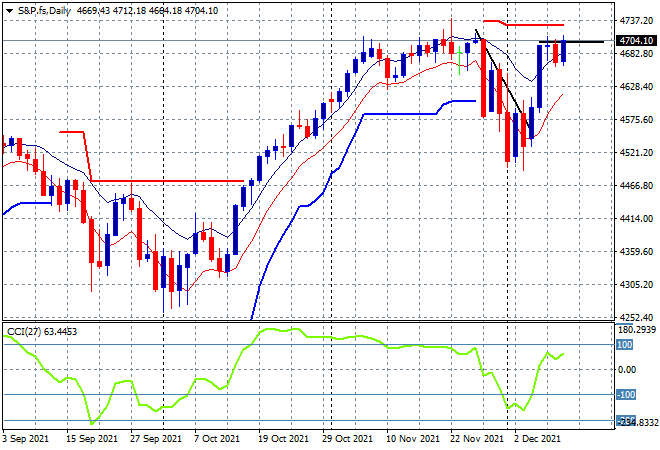
Wall Street basically ignored the inflation print and damned the torpedoes with the NASDAQ up 0.7% while the S&P500 launched nearly 1% higher to break back above the 4700 point level, closing the week out almost near its recent high at 4712 points. The daily chart shows price action really bunching up at this key level and now very ready to push through as it sets up a potential inverted head and shoulders pattern here:
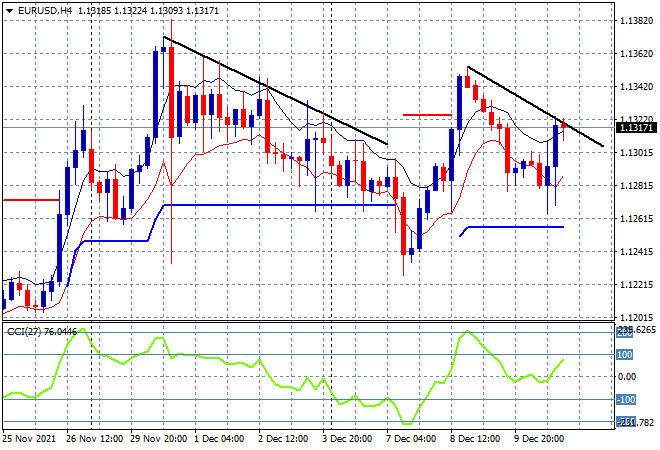
Currency market volatility engaged higher obviously on the US and German inflation prints, with new highs in both sending Euro higher at least, with the union currency finishing just above the 1.13 handle for the week. I had expected some consolidation here in the short term with a very mild retracement below the 1.13 handle at a neutral support level but this is still not providing a real clue to short term direction with conflicting signals:
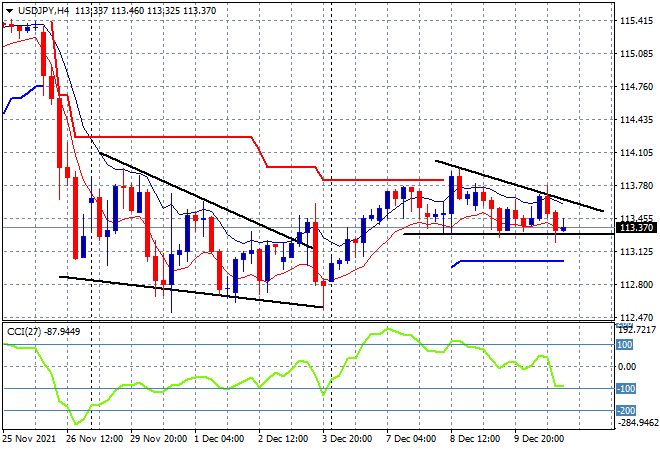
The USDJPY pair was flat most of the trading week and continued to deflate on Friday night despite the big inflation print, finishing just below the mid 113 level. Notice the descending triangle pattern on the four hourly chart, combined with weak momentum readings and the inability to clear overhead resistance at the 114 handle broadcasting a probable downturn here in line with longer term charts:
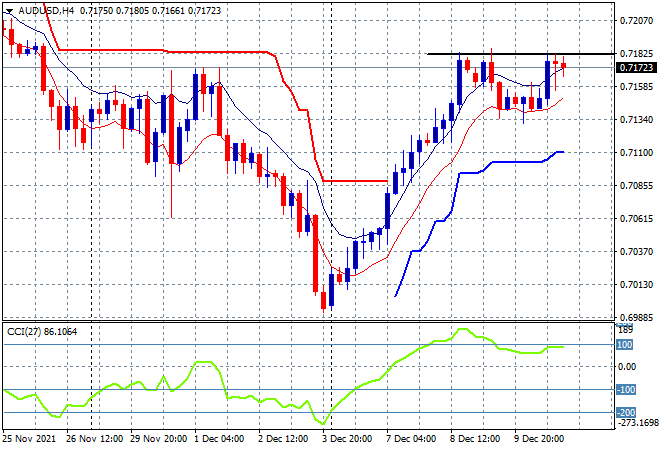
The Australian dollar made a small breakout early on Friday night but couldn’t stick it past the previous intraweek high nor last week’s higher, finishing the week still below the 72 handle. Its been a very solid trading week for the Aussie, having bottomed out and then rallied hard here, forming a lovely V bottom pattern on the four hourly chart at least. That resistance overhead, just below the 72 handle is the area to watch as we start a new trading week:
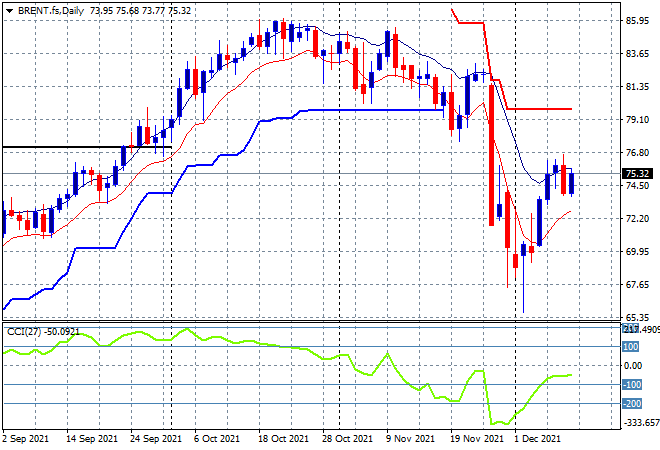
Oil prices were able to bounce back from a recently pullback but the Brent crude marker still looks a little weak here, finishing the week out just above the $75USD level. The former monthly resistance level at $77 is still the target to reach in this bounceback, but daily momentum is still not yet positive with a lot of upside resistance to get through, so this is likely to turn into a dead cat bounce and then some consolidation around the psychologically important $70 level:
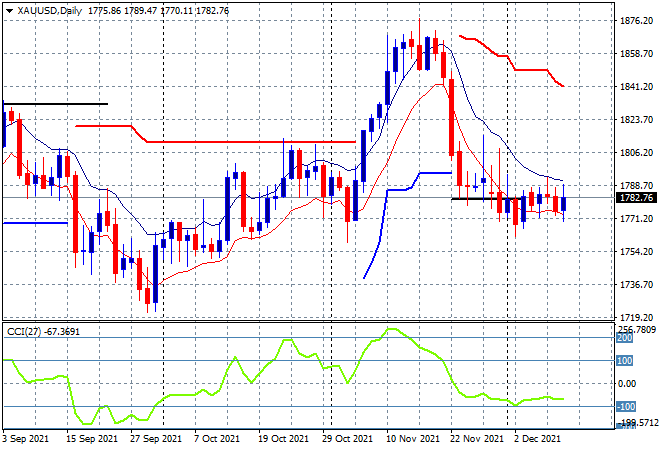
Gold is still depressed but at least it didn’t make a new weekly low as it remains slightly above relatively weak support at the $1780USD per ounce level, failing to make any intrasession breakouts stick. Short term momentum had been looking a little more bullish but the failure to punch through overhead resistance or create a new significant daily high means the $1800 level could remain out of reach for sometime:
Glossary of Acronyms and Technical Analysis Terms:
ATR: Average True Range – measures the degree of price volatility averaged over a time period
ATR Support/Resistance: a ratcheting mechanism that follows price below/above a trend, that if breached shows above average volatility
CCI: Commodity Channel Index: a momentum reading that calculates current price away from the statistical mean or “typical” price to indicate overbought (far above the mean) or oversold (far below the mean)
Low/High Moving Average: rolling mean of prices in this case, the low and high for the day/hour which creates a band around the actual price movement
FOMC: Federal Open Market Committee, monthly meeting of Federal Reserve regarding monetary policy (setting interest rates)
DOE: US Department of Energy
Uncle Point: or stop loss point, a level at which you’ve clearly been wrong on your position, so cry uncle and get out!