
Equity markets were mixed again in fortune overnight although Wall Street came through with a late bounce despite another round of hawkish Fed speeches, with post close futures indicating a bit more hope sneaking into Asian equities for the last session of the week. The bond market continues to broadcast earlier than expected Fed rate hikes although the 10 year Treasury yield blipped a smidgen higher, but still below the 1.5% level while currency markets were quite flat as the USD continued to firm slightly against most of the majors, particularly the Australian dollar. Commodity markets saw a little bounce across the board with oil and copper both up 1% while iron ore faltered back to the $100USD per ton level and gold cracked a little more under pressure to push even further below its previous daily support level.
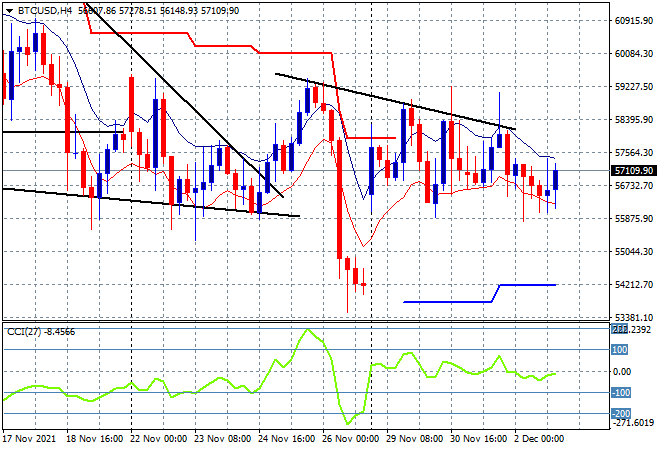
Bitcoin remains in a tenuous slight downtrend, unable to move substantially higher although a late rally saw it put back above the $57K level again overnight. The four hourly and daily charts still look bearish as daily resistance at the $59K level has not yet been cleared, although short term support is still firm at $56K:
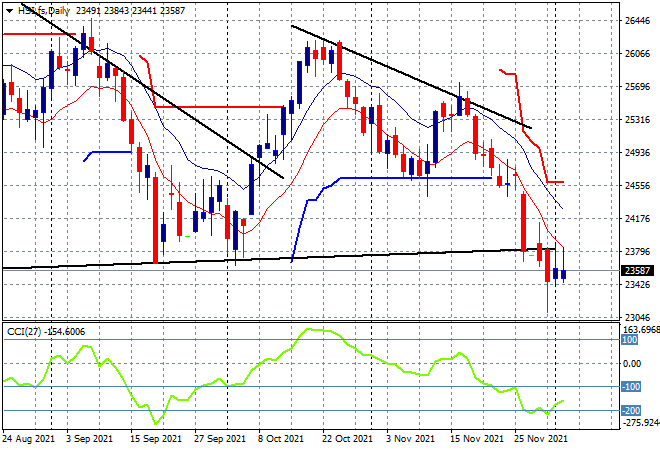
Looking at share markets in Asia from yesterday’s session, where Chinese shares are somewhat listless despite a previous solid session with the Shanghai Composite largely unchanged at 3574 points while the Hang Seng Index has continued its very tepid rebound with a 0.4% lift higher to 23765 points. Daily momentum remains oversold with muted upside price action so this is nowhere near a swing setup just yet but at least staves off more downside for now:
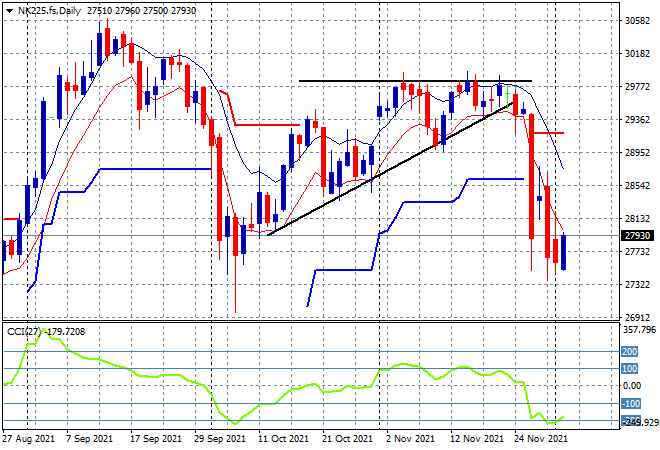
Japanese markets failed to stabilise as expected with the Nikkei 225 closing 0.6% lower at 27753 points. Futures are however indicating a better finish to the trading week, helped along by a slightly weaker Yen overnight, but moreso from the late rally on Wall Street. Price had been dicing with breaking below the September support levels just above 27000 points, but while momentum remains in a very oversold condition there is the potential for a nice swing setup here:
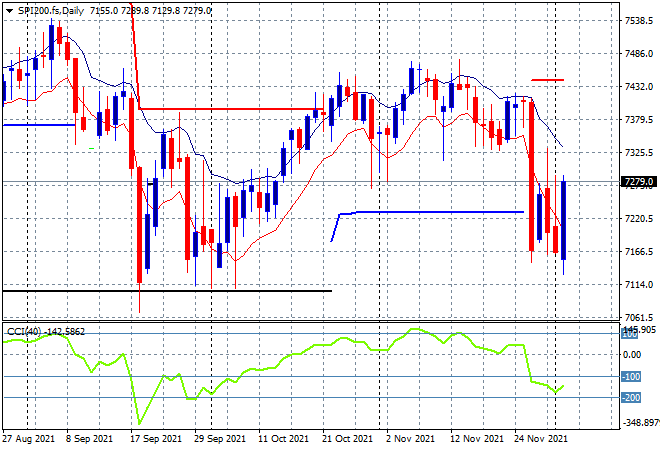
Australian stocks had another mild selloff with the ASX200 closing 0.1% lower at 7225 points. SPI futures look very bullish however, up more than 50 points or nearly 0.8% given the overnight upside volatility on Wall Street, so the potential for a rollover to the next level of monthly support at 7100 points has been swept aside for now, but I remain extremely cautious here:
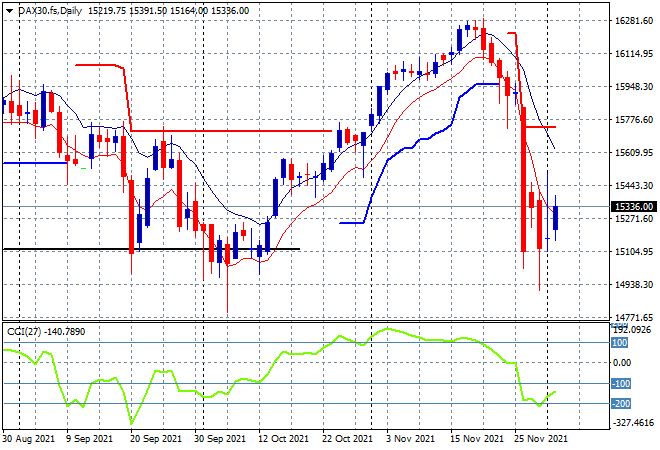
European markets remain unsettled with another mixed session overnight with the German DAX taking back most of its previous gains to finish down 1.3% to 15263 points, but it did recover a lot of that during post trade futures as Wall Street rallied. The daily chart is showing continued buying at the September lows and while this still has the potential to swing wildly higher on any positive news, the bears are still in charge here as daily momentum remains extremely oversold – but could weekly/monthly support levels hold the key here?
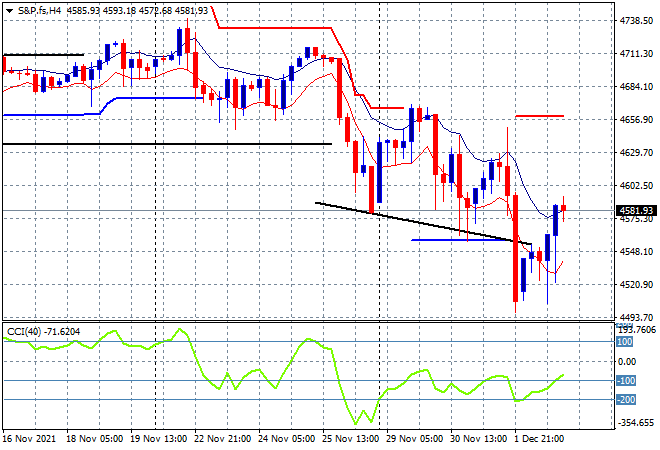
Wall Street finally found the bounce post the hawkish Powell comments despite his deputies keeping on the taper talk overnight as the latest initial jobless claims didn’t spook equities at least. The NASDAQ lagged but still gained over 0.8% while the S&P500 filled a lot of its recent daily loss with a 1.4% surge back up to the 4577 point level. The four hourly chart shows price action finally getting some, although the high moving average has only been briefly pushed over. As I said previously, this has the power to extend further south if the BTFD crowd does not step in and make a repeat of February last year:
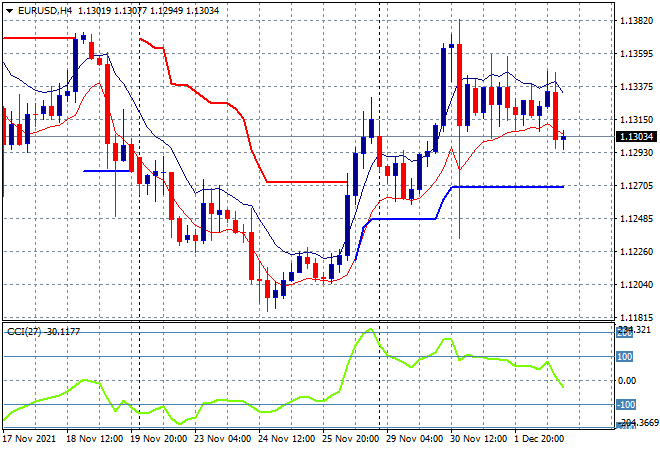
Currency market volatility reduced again, helped by expected results in weekly US initial jobless claims and nothing untoward in a slew of Fed speeches overnight. The Euro slipped slightly agains USD again, moving down slightly to remain just above the 1.13 handle. The four hourly chart is switching from nominally bullish to neutral at best as momentum flat lines, despite a direction forming if you look through the intrasession volatility. While the overall downtrend is still in play, there is growing potential of a follow through here above the previous weekly high at the 1.1370 level if ATR support can hold:
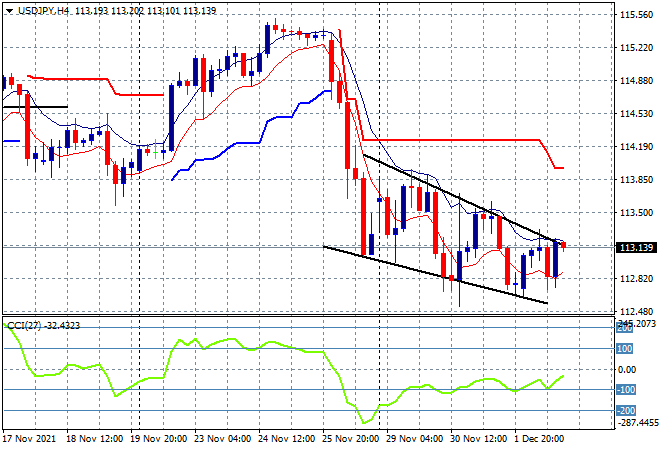
The USDJPY pair remains in its own downside channel despite some internal buying support building here with a slight blip above the 113 handle as Yen safe haven buying abated somewhat overnight. The pair still looks fragile again this morning with price action still unable to move higher above the four hourly moving average band which continues to point down and momentum remains negative, if not oversold:
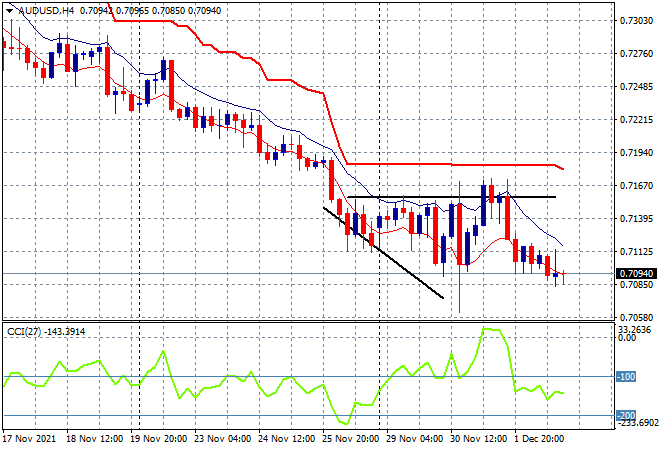
The Australian dollar continues it mild deflation amid an overall medium term downtrend, remaining below the 71 handle again despite slightly higher commodity prices as the stronger USD continues to weigh. Short and medium term momentum are still oversold, and price shows little signs of recovering:
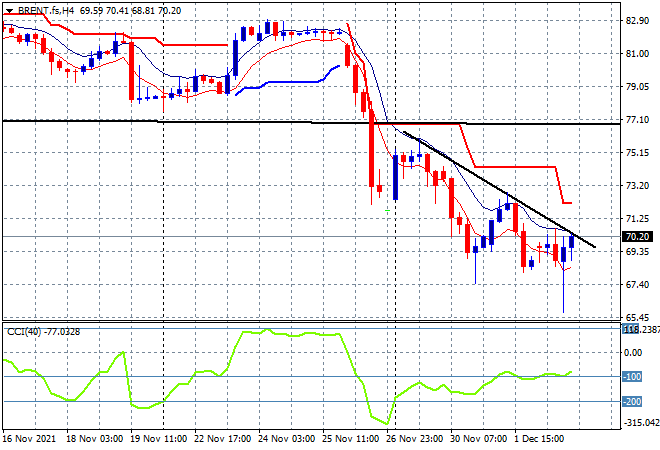
Oil is trying to rally and find a bottom here with Brent finishing back above the $70USD level but short term volatility remains high with no real signs of bounceback as the four hourly chart show price still on a downtrend. Indeed it still shows the former monthly resistance level at $77 still a long way away, proving too strong alongside very negative momentum:
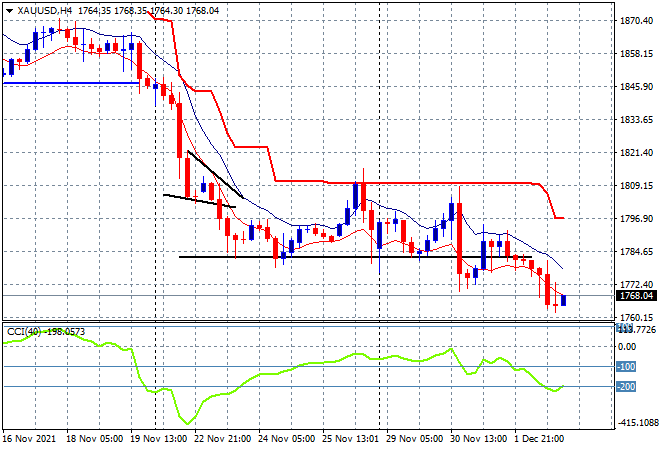
Gold also remains in the doldrums with another blip lower, this time trawling below the $1770USD per ounce level, having definitely broken below previous daily support at the $1780 level. Momentum remains quite oversold in the short term and setting up for more downside below:
Glossary of Acronyms and Technical Analysis Terms:
ATR: Average True Range – measures the degree of price volatility averaged over a time period
ATR Support/Resistance: a ratcheting mechanism that follows price below/above a trend, that if breached shows above average volatility
CCI: Commodity Channel Index: a momentum reading that calculates current price away from the statistical mean or “typical” price to indicate overbought (far above the mean) or oversold (far below the mean)
Low/High Moving Average: rolling mean of prices in this case, the low and high for the day/hour which creates a band around the actual price movement
FOMC: Federal Open Market Committee, monthly meeting of Federal Reserve regarding monetary policy (setting interest rates)
DOE: US Department of Energy
Uncle Point: or stop loss point, a level at which you’ve clearly been wrong on your position, so cry uncle and get out!