
BofA with the note:
In the late-1960s, Arthur Okun created a simple statistic to capture the cost of stagflation. His“misery index” simply added the unemployment rate to headline inflation. Over time the index dropped off the radar screen, but it may be time for a comeback. Tomorrow both we and the consensus expect year-over-year CPI inflation to rise from 5.4% to 5.9% for October.This more than offsets the drop in the unemployment rate, boosting the misery index to 10.5%. That is the highest in recent decades, outside of a couple years around the Great Financial Crisis, and the 1990 recession and oil price spike (Exhibit 1).
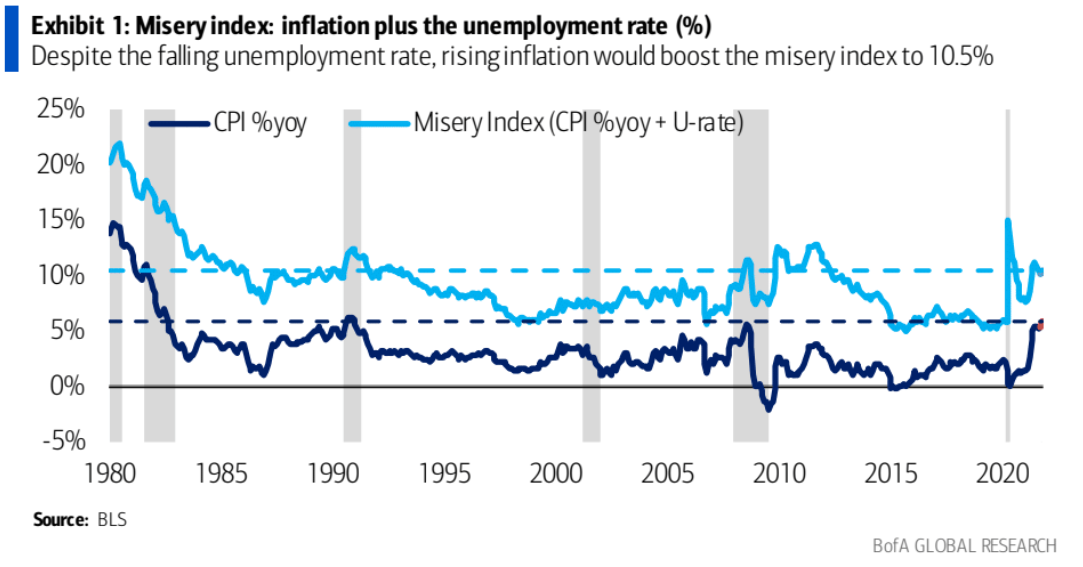
The good news is that a big chunk of this is the temporary impact of supply constraints.Worker shortages and capacity issues have both slowed the drop in the unemployment rate and caused many prices to spike higher. With the Delta wave having receded, however, we expect the labor market to pick up speed even as headline inflation cools. For example, the end of next year we expect the Misery Index to drop to 6.3%,with a 3.5% unemployment rate and 2.8% inflation.
