
Central banks remaining on their hawkish bent saw stock markets on Friday night oscillating between caution and fear with Wall Street barely scratching in with a positive result as European shares pulled back on concerns over a stalled German election. Risk currencies also pulled back in unison with USD strengthening against Euro, Yen and Aussie although gold was able to hold on to some meagre gains. Action in bond markets continues to be stilted with yet another selloff in Treasuries as the 10-year yield starts to approach the 1.5% level while commodities were slightly bullish for a change with oil and copper both climbing nearly 2% as iron ore finished the week above the key $100USD per tonne level.
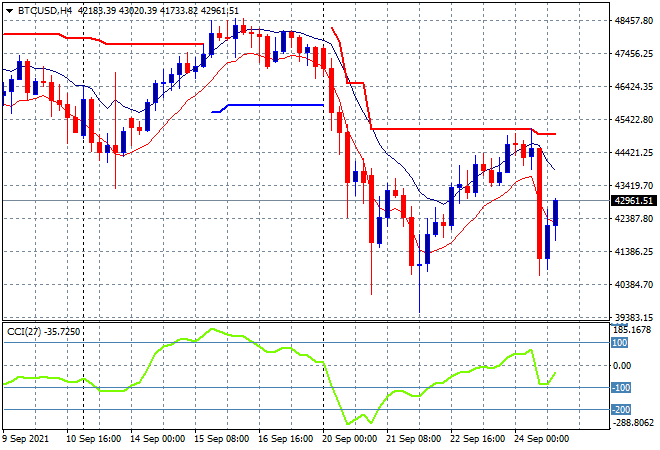
Bitcoin however had a tumultous session given the latest Chinese ban on crypto currencies, with a swift pullback to the intraweek low at the $40K level before a last swing saw it officially finish the week at just below the $43K level instead. A lot of volatility going on here with daily and four hourly resistance quite clear and firm at the $45K level, so even with a probably gap higher due to weekend trading this could be another swinging week for Bitcoin with support at $40K the key level to watch:
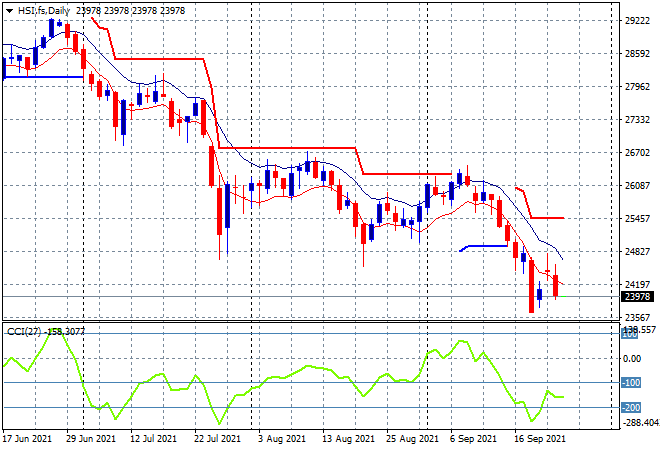
Looking at share markets in Asia from Friday’s session, where the Shanghai Composite fell sharply into the close, finishing 0.8% lower at 3613 points with the Hang Seng Index followed suit, down over 1.3% at 24192 points. The daily chart remains under a lot of pressure here and while sentiment and momentum got oversold too fast it looks like it hasn’t been enough for the dead cat bounce to catch life with another downturn below the 23500 level quite likely on the reopen:
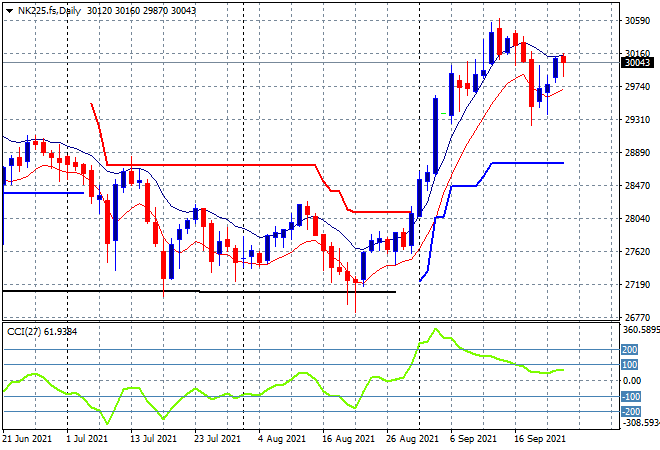
Japanese markets reopened after a short midweek holiday with a surge in stocks as the Nikkei 225 closed 2% higher 30248 points. This is mainly due to the selloff in Yen and while support is pretty obvious at the 29300 point level it may take more co-ordinated risk taking across other markets to fire this up again above the key 30,000 resistance level for the next trading week:
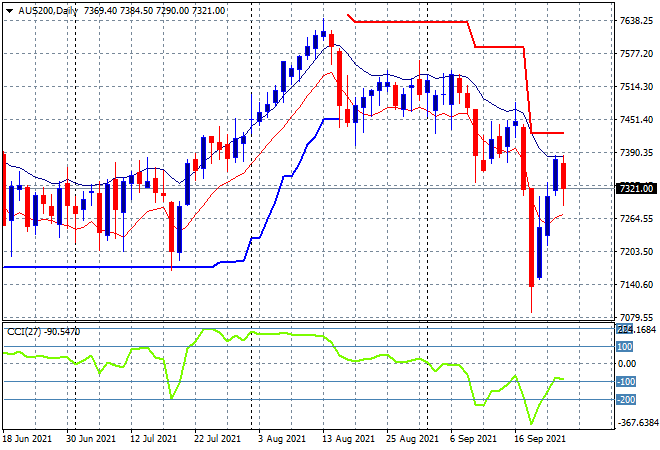
Australian stocks were the odd one out, with the ASX200 finishing 0.4% lower at 7342 points, failing to get back above previous medium term support. SPI futures are flat but we should see a probable 20-40 point drop on the open in line with Wall Street’s problematic finish on Friday night. The daily chart is showing a potential rollover of the dead cat bounce that saw it thrust verily into the 7400 point zone after a swift move down to the 7000 point level as iron ore prices collapses. As I mentioned last week, watch daily momentum which is nowhere near positive so until overhead ATR resistance at the 7400 point area is broken through again this dip is not yet over:
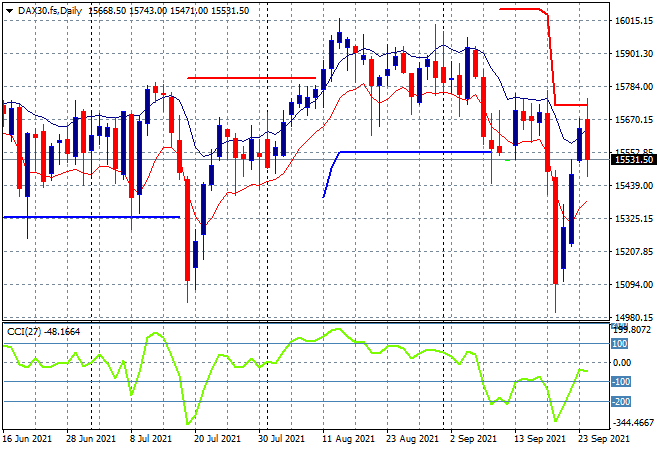
European markets were looking good to start with but ended up selling across the continent as sentiment soured once more. The German DAX retraced almost all of its previous gains, finishing 0.7% lower at 15531 points with an ominous bearish engulfing candle on the daily chart. While the next level of resistance at 15700 points is not that far away, sentiment is keeping this market depressed so watch for a catalyst out of the latest elections and a slightly weaker Euro to help glide things along:
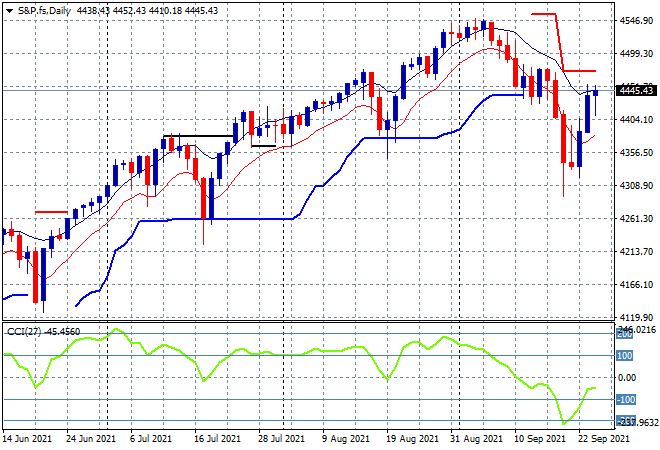
Wall Street eventually finished flat with no real change in direction, with tech stocks pulling back slightly while the S&P500 finished marginally higher, up 0.2% to close at 4455 points. This keeps price well above the neckline at the 4400 point level of that large head and shoulders pattern on the daily chart but in the short term does not keep it out of trouble. Note strong overheard resistance at the recent daily highs around the 4470 point level that may prove too strong even for the BTFD crowd:
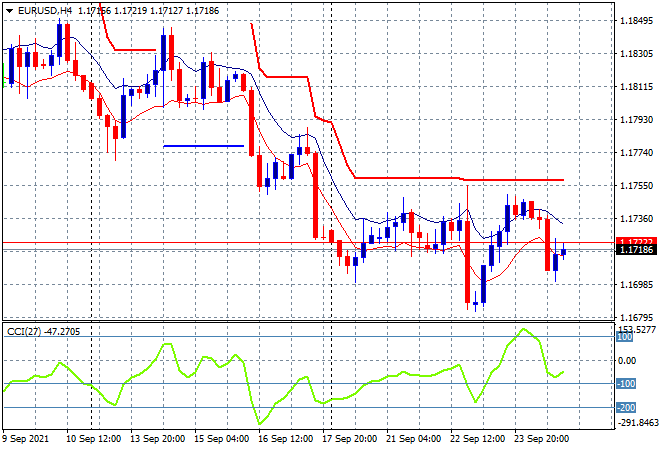
Volatility was basically on the downside against USD on currency markets on Friday night, capping off a week of continued selling pressure against the majors. Euro had a minor oscillation mid week that hasnt changed the sideways and still bearish trend with a finish just above the 1.17 handle for the week. Momentum has swung back to negative readings in the short term again with overhead trailing ATR resistance at the mid 1.17 level still not cleared so watch for more downside here:
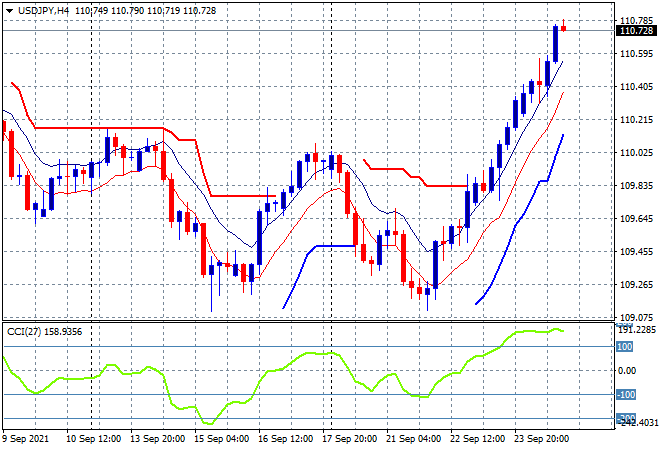
The USDJPY pair continues to zoom ever higher as short covering of Yen pushed right through the 110 handle to finish at a new weekly and monthly high. This is puts more pressure on the medium term downtrend, with momentum nicely overbought now but price actions seems to be accelerating far too quickly, so watch for a potential reversion back to the 110 level proper:
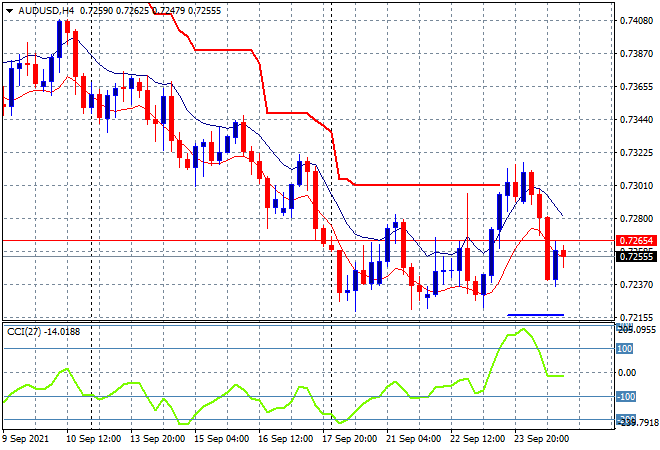
The Australian dollar was unable to continue its false break out, following the trajectory of iron ore once more, instead giving up and falling through the 73 handle on Friday night to make a new weekly low instead. Overhead ATR resistance remains very solid here and could prove an anchor point going forward:
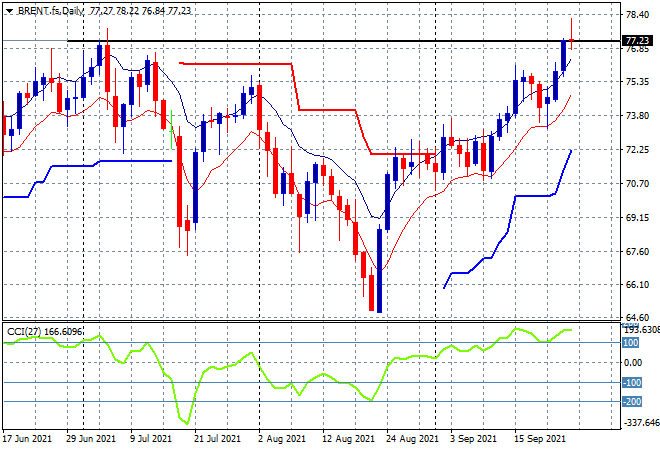
Oil again is pushing for more upside inflation with Brent crude finishing the week above the $77USD per barrel level with price action almost pushing through the medium term downtrend. Momentum readings are poised here to continue higher with building support at the low moving average level as a great uncle point:
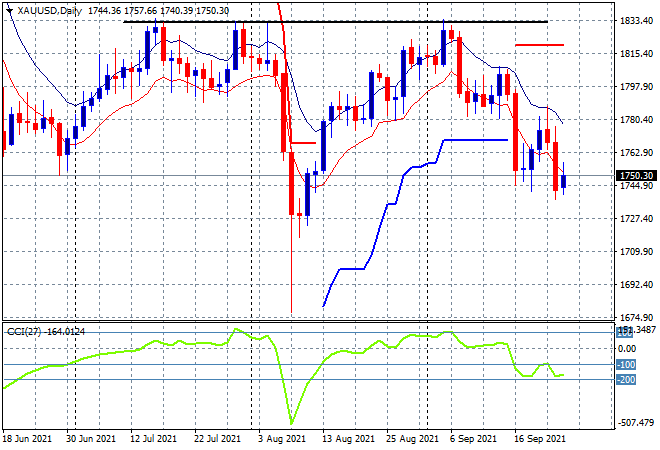
Gold remains under a lot of pressure from hawkish central banks hell bent on tapering but Friday saw a glimmer of hope for gold bugs as it defended the $1750USD per ounce level. The daily chart however still shows a huge weight of resistance above that has not been cleared in the short or medium term. As I said last week, we could see a full retracement to the previous flash crash lows at the $1700USD per ounce level:
Glossary of Acronyms and Technical Analysis Terms:
ATR: Average True Range – measures the degree of price volatility averaged over a time period
ATR Support/Resistance: a ratcheting mechanism that follows price below/above a trend, that if breached shows above average volatility
CCI: Commodity Channel Index: a momentum reading that calculates current price away from the statistical mean or “typical” price to indicate overbought (far above the mean) or oversold (far below the mean)
Low/High Moving Average: rolling mean of prices in this case, the low and high for the day/hour which creates a band around the actual price movement
FOMC: Federal Open Market Committee, monthly meeting of Federal Reserve regarding monetary policy (setting interest rates)
DOE: US Department of Energy
Uncle Point: or stop loss point, a level at which you’ve clearly been wrong on your position, so cry uncle and get out!