
Its pussy galore following the recent selloff’s on stock markets with dead cats bouncing all over the place overnight. Wall Street “steadied” by trying to recover the previous loss after a proper bounce on European equities as we head into the next FOMC meeting with Fed tapering fears still overwhelming risk sentiment. The USD was all over the place against the major risk currencies, with gold seeing a small bid higher. Treasury bond yields were range traded but still low on the safe haven bid with commodities generally positive but poised here as the iron ore rout looks set to continue.
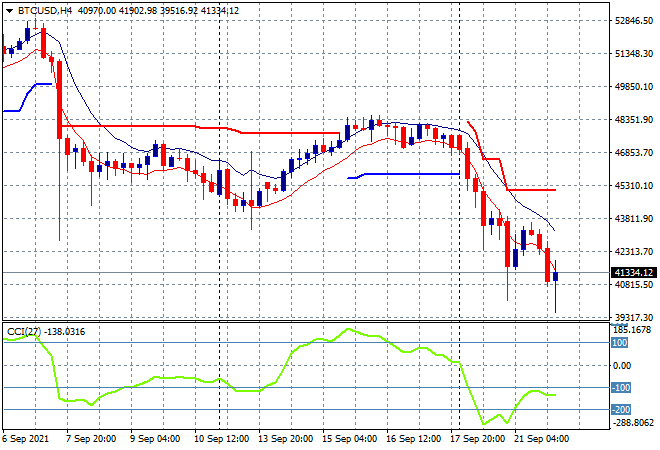
Bitcoin had a proper correction during the Asian session yesterday before another proper flump overnight alongside other cryptocurrencies with a swift move below the $40K level for a new monthly low. There’s almost no support here but the last couple of sessions on the four hourly chart and oversold momentum maybe pointing to a short term reversion or swing trade as volatility remains very high:
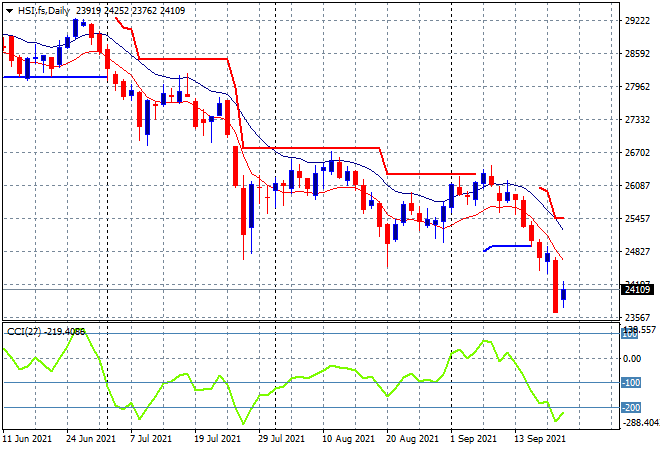
Looking at share markets in Asia from yesterday’s session, where the Shanghai Composite remained closed with the Hang Seng Index putting in a mild uptick, closing 0.5% higher after its previous big whallop. The daily chart now shows momentum exceedingly oversold and ready to bounce back, but there’s little support here yet as the 25000 point support level evoparated. Turn this chart upside down and you’d still be bullish! The collapse in sentiment is still likely to send it back to the late 2020 lows nearer 22000 points:
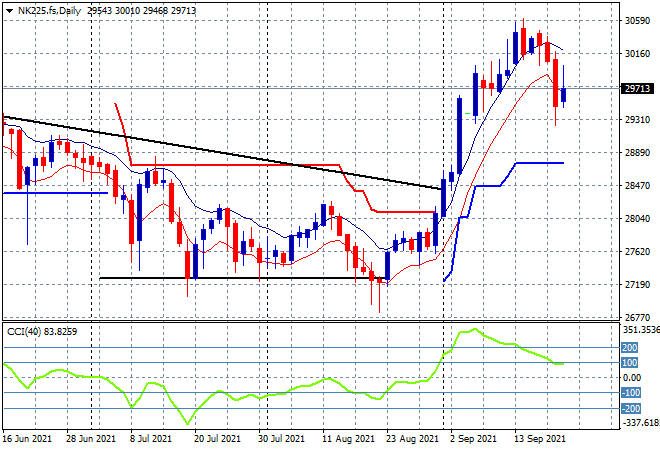
Japanese markets reopened and immediately gapped lower with the Nikkei 225 losing more than 2% to 29839 points as it begins a rollover. The daily chart shows how this was setup with the very overextended rally inverting sharply below the 30000 point level which had firmed as the obvious resistance level. Watch the lower moving average where price is likely to be anchored but this is not yet a new downtrend until we see another proper close below:
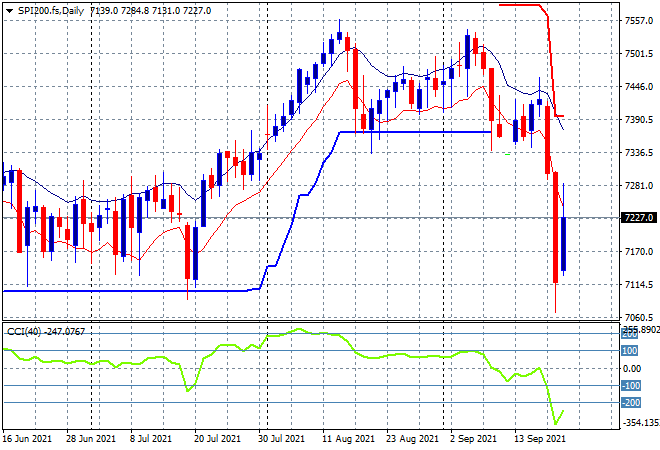
Australian stocks managed to pull off a small rise at the close, with the ASX200 finishing 0.3% higher at 7273 points but still well below previous medium term support. SPI futures are down only 15 points or so which isn’t much of an indicator with the daily chart showing an inside bullish session that won’t be enough to stave off more selling, although there can be a case of support building here at just above the pre July rally level around 7100 points:
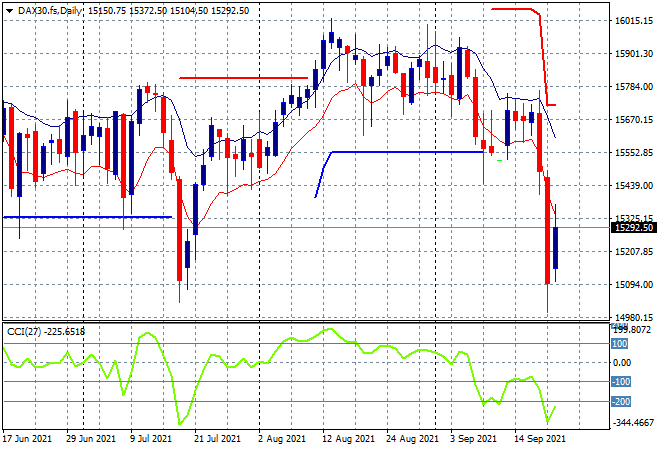
European markets started the dead cat craze with some lovely bounces after being oversold the previous session with the German DAX officially closing 1.4% higher at 15348 points but it pulled back some of this in futures during the Wall Street session. The daily chart remains a pretty clear bearish picture, with ATR support at the 15500 point level wiped out, with traders hoping that the next support level at the July lows will kick in next. As I said yesterday, this move is way overdone and ripe for a pullback, but that depends on Wall Street:
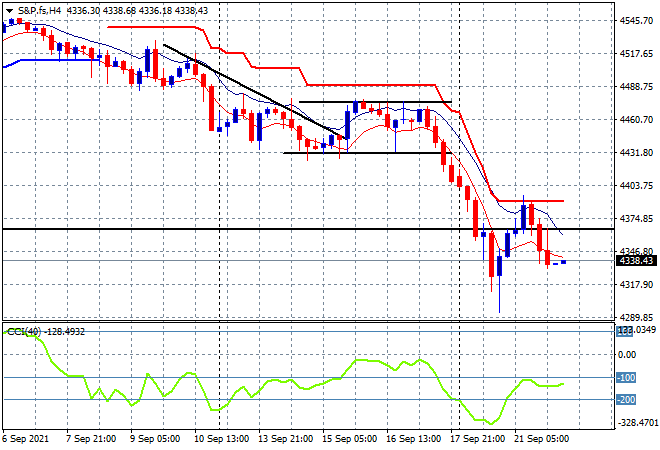
Wall Street loves optimism more than realism and responding in kind by patting the kitty and sending it upwards, but it was shortlived with the S&P500 eventually rolling over and closing 0.1% lower at 4354 points. The right hand shoulder of a large bearish head and shoulders pattern remains on the daily chart, with the neckline at the 4400 point level still definitively broken and with price below the July lows. Momentum is extremely oversold and ripe to pullback but last night’s price action was very telling with overhead ATR resistance undaunted:
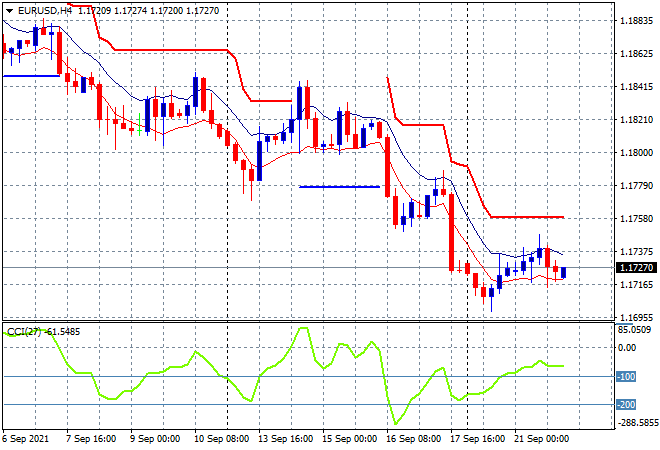
Currency markets continue to reduce in volatility with the USD overall largely unchanged as Euro tightly range traded around the low 1.17 level, without making a new intersession low. Momentum has consolidated from its considerably oversold condition but is still negative and the overall picture remains so as well, with strong resistance at the 1.1750 mid level still far away:
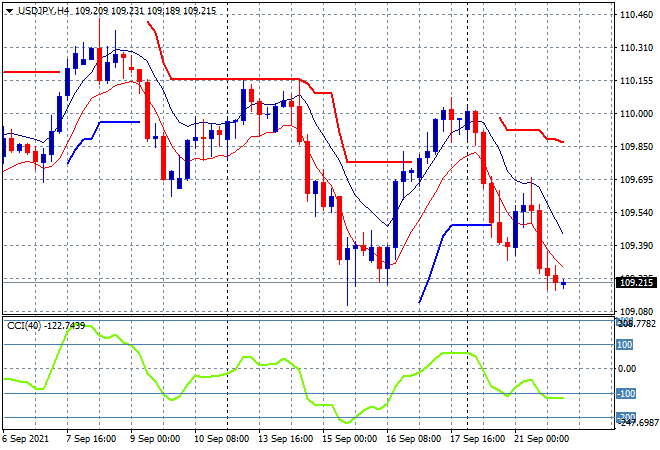
The USDJPY pair basically acted as risk proxy and did the Japanese dead cat bounce wave pattern, lifting up towards the 109.70 level and then selling off sharply to make a new weekly low instead. Short term momentum had been pointing to this as did the price action of the moving average band with the medium term trend remaining solidly down:
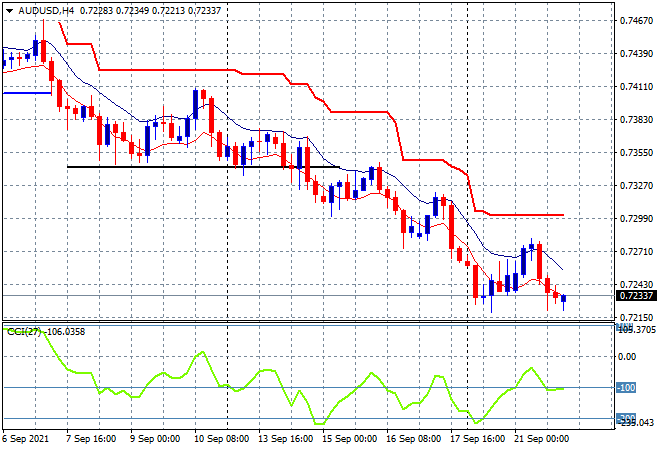
The Australian dollar was trying to steady itself again but failed to make any traction, instead returning to the start of week lows at the 72.30 level. Overhead ATR resistance remains very solid here and although some support is slowly building above the 72 cent level it may not be enough to stave off the ongoing selloff as iron ore continues to dive:
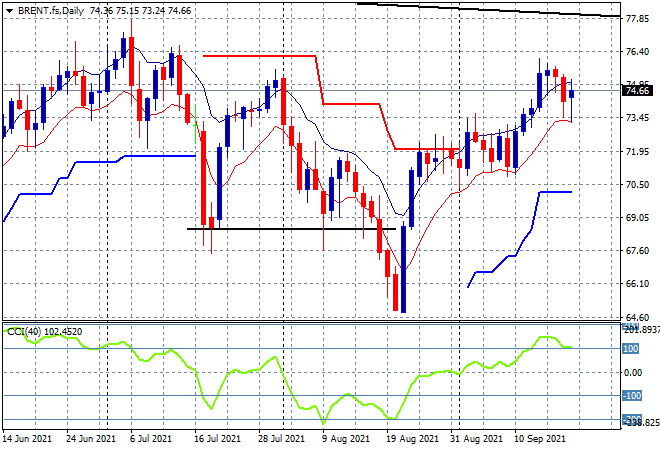
Brent crude finished nearly 1% higher, somewhat in line with risk sentiment, but still unable to substantially continue its follow through on the recent breakout with resistance slowly building here at the $75USD per barrel level. Price action continues to suggest exhaustion is settling in here with momentum rolling over from its prior overbought levels, with the June highs at $77 plus possibly out of reach now:
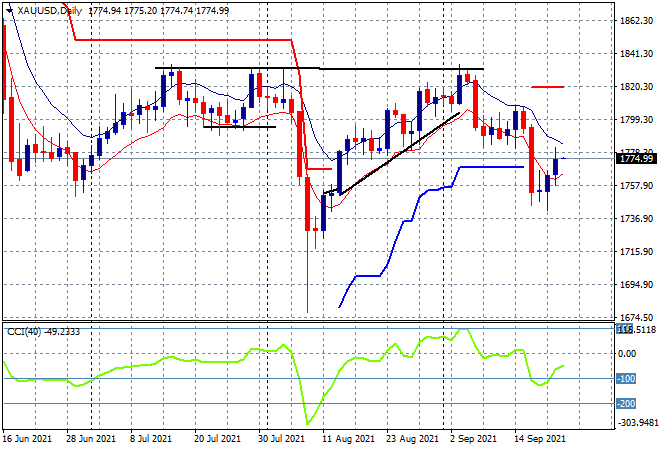
Gold was able to keep firm in the wake of the risk off events, finishing more than $10 higher at the $1774USD per ounce level. Daily ATR support remains broken and price has a ways to get before returning to the $1800 key level too, so watch for the recent daily lows that must be supported here or the next stage could be a full retracement to the previous flash crash lows at the $1700USD per ounce level:
Glossary of Acronyms and Technical Analysis Terms:
ATR: Average True Range – measures the degree of price volatility averaged over a time period
ATR Support/Resistance: a ratcheting mechanism that follows price below/above a trend, that if breached shows above average volatility
CCI: Commodity Channel Index: a momentum reading that calculates current price away from the statistical mean or “typical” price to indicate overbought (far above the mean) or oversold (far below the mean)
Low/High Moving Average: rolling mean of prices in this case, the low and high for the day/hour which creates a band around the actual price movement
FOMC: Federal Open Market Committee, monthly meeting of Federal Reserve regarding monetary policy (setting interest rates)
DOE: US Department of Energy
Uncle Point: or stop loss point, a level at which you’ve clearly been wrong on your position, so cry uncle and get out!