
Wall Street fell for the fifth consecutive session on Friday night, with a significant fall in industrial stocks due to concerns about growth post the US vaccination mandates. Bond yields rose however with the USD lifting slightly higher as European stocks also put in mixed finishes for the trading week as the latest industrial production figures produced an unclear picture for growth prospects. Commodity markets were much more bullish with oil lifting more than 2%, copper up nearly 4% while gold prices continued to fall back after crossing below the key $1800USD per ounce level.
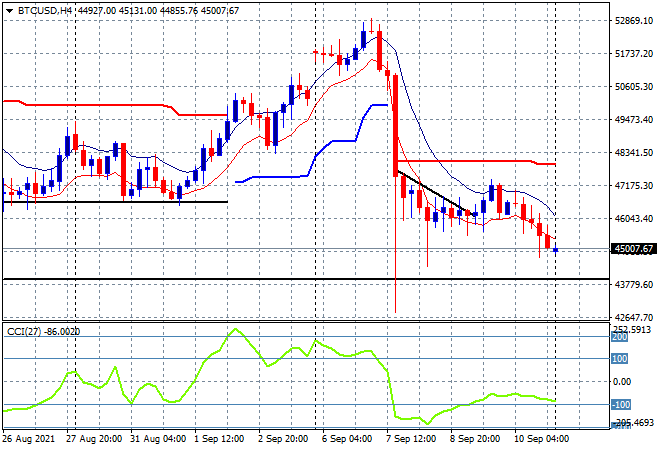
Bitcoin failed to find support at just the $46K level after its recent flash crash/pump and dump with the four hourly chart clearly showing a rejection of overhead ATR resistance at the $48K level. This continued throughout the Friday night session and through this weekend with an open at the $45K level proper almost getting down to the early August lows (lower black horizontal line):
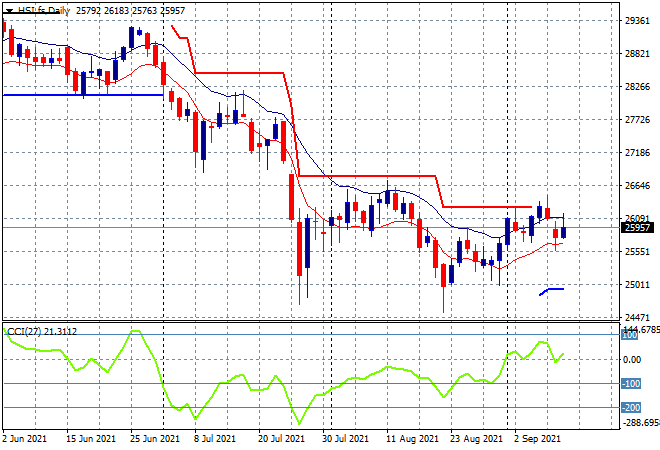
Looking at share markets in Asia from Friday’s session, where the Shanghai Composite put in a solid finish, cracking through the 3700 point level while the Hang Seng Index reversed all its losses from the previous session, up over 1.9% to 26205 points. The daily chart is still showing price trending higher but struggling to decisively clear its own high moving average nor trailing ATR resistance above the 26000 point level so despite a nice rally to end the week, direction remains elusive:
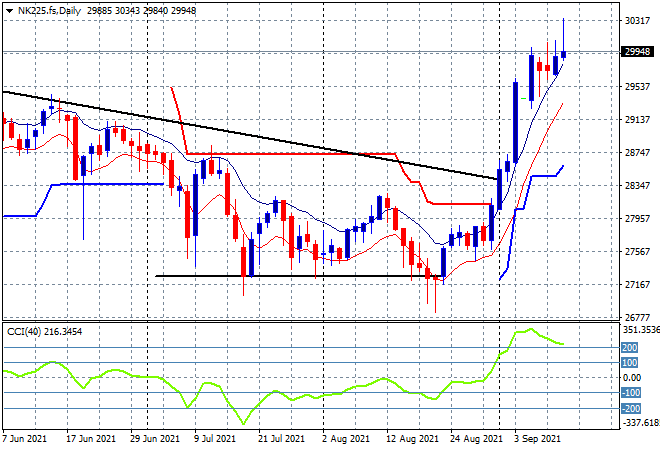
Japanese stocks paused only briefly and have re-engaged to the upside, with the Nikkei 225 finishing 1.2% higher to 30381 points, continuing its epic run. The daily chart continues to show a very overextended rally with the 30000 point level still a possible resistance level with futures indicating this as a likely pullback area in line with other risk correlations due to Wall Streets’ big pullbakc on Friday night. There could be a high risk/reward short trade opportunity brewing here:
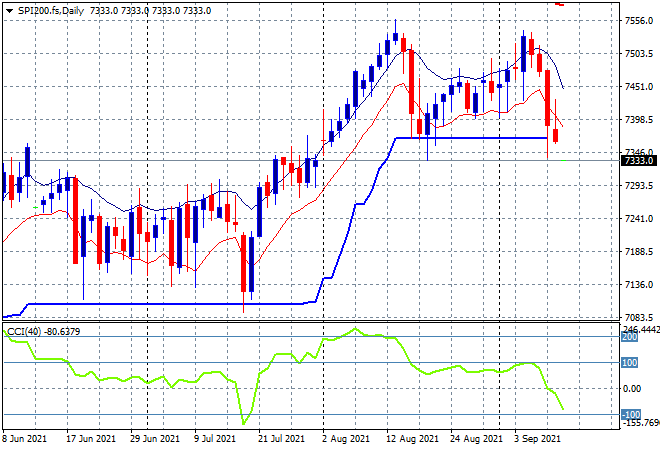
Australian stocks had the most modest of sessions with the ASX200 eventually finishing only 0.5% higher at 7406 points. SPI futures are down nearly 30 points with all of Friday’s move likely to be retraced and then some as price remains unable to clear its own high moving average. Although ATR support has been very solid at the 7360 point level, this could break early in the trading week on poor risk sentiment:
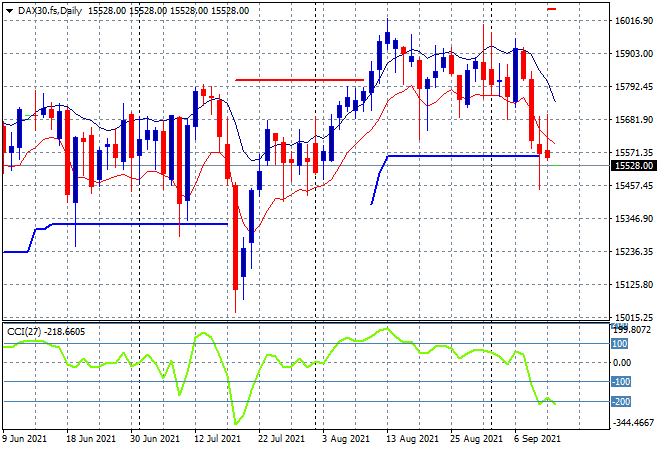
European markets were still all over the place with volatility spiking again, as the FTSE proved the only bourse able to put in a positive return after previously losing over 1% while the German DAX pulled back around 0.1% in a relatively bearish session hot on the heels of the ECB meeting, finishing at 15609 points. The daily chart is still showing a bearish mood with a breakdown still possible below ATR support at the 15500 point level to make for a quick dip back to the 15000 point level reached in July:
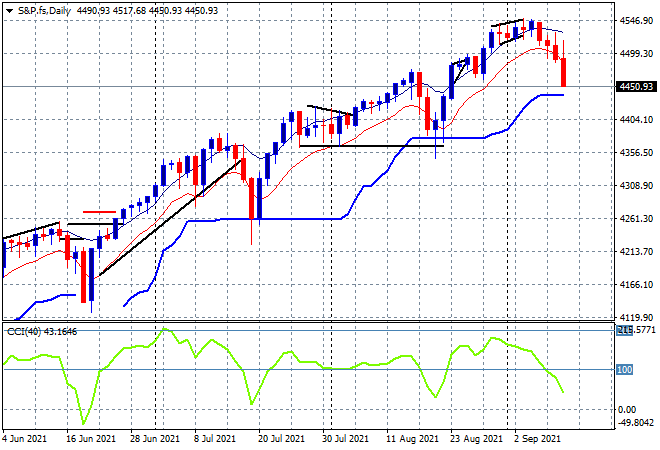
Wall Street however really showed its hand on Friday night with tech and industrial stocks all falling in unison, with the NASDAQ down 0.9% and the S&P500 finishing 0.8% lower at 4458 points, solidifying the falls below the key 4500 point level. The daily chart shows a nice rollover into a dip setup that so far has not been filled by the usual BTFD crowd, particularly after dropping through that 4500 level. Is a wider correction or is this just another repeat of the steps up on this rally:
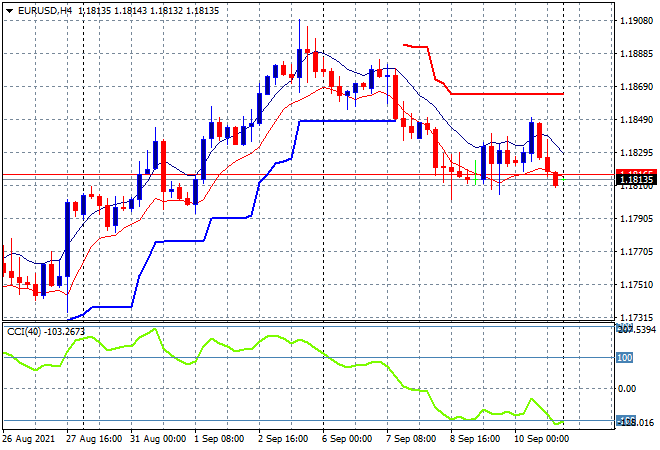
Currency markets were relatively flat on Friday night with USD strength still dominating direction or lack thereof with the Euro putting in a new weekly low here to finish just above the 1.18 level. Momentum is decisively in the negative zone and about to get oversold as the false breakout above the four hourly high moving average and a push back to the “bottom” at the 1.18 handle looks ominous going forward:
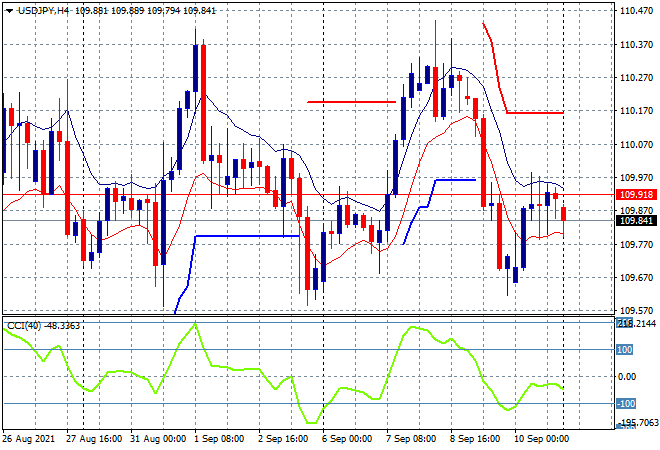
The USDJPY pair however was more or less unchanged for Friday, finishing the week at the 110 handle after some previous safe haven Yen buying, staving off a new weekly low in the process. The four hourly and daily charts still look like sine waves and not providing any real directional plays so far:
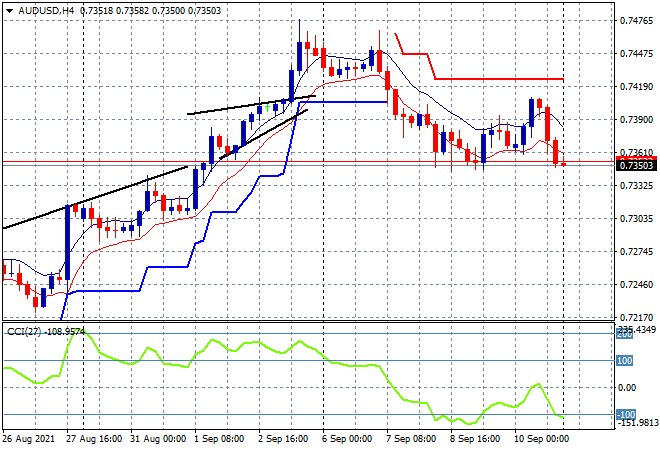
The Australian dollar was slowly finding some support at the mid 73 level but like Euro faced a false breakout move that saw it return to the intrasession lows for the week. Short term momentum is now properly in the negative zone but not yet showing a breakdown, so watch for a potential weekend gap play here to foul things up. This could go lower however if iron ore prices don’t pick up soon, regardless of the USD:
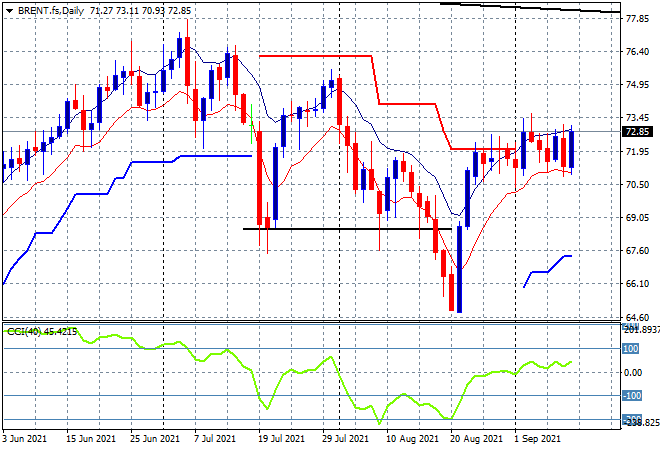
Brent crude finished more than 2% higher on Friday but notably this did not lead to a proper breakout, finishing just below the $73USD per barrel level. Price action is bunching up into a consolidation that should provide a volatile catalyst to burst higher if short term momentum is to be believed, so watch for any move above $73:
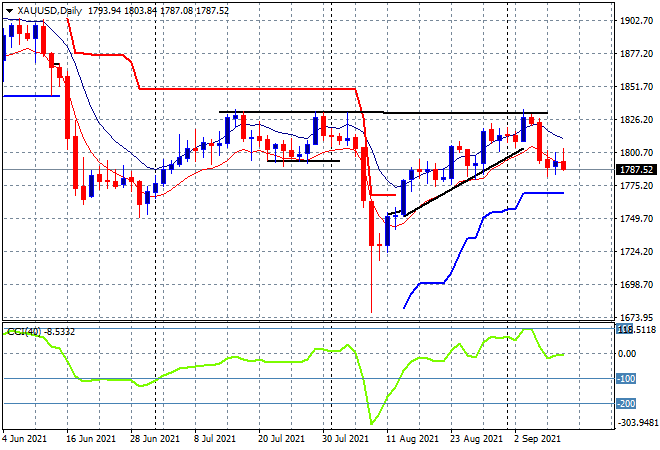
Gold stabilised in its fall below the key $1800USD per ounce psychological level with intrasession volatility pointing to more downside when the trading week restarts. The rejection of overhead resistance at the $1830 level is still quite telling and will likely see more selling going forward so watch for the ATR daily support level to be the target in this pullback:
Glossary of Acronyms and Technical Analysis Terms:
ATR: Average True Range – measures the degree of price volatility averaged over a time period
ATR Support/Resistance: a ratcheting mechanism that follows price below/above a trend, that if breached shows above average volatility
CCI: Commodity Channel Index: a momentum reading that calculates current price away from the statistical mean or “typical” price to indicate overbought (far above the mean) or oversold (far below the mean)
Low/High Moving Average: rolling mean of prices in this case, the low and high for the day/hour which creates a band around the actual price movement
FOMC: Federal Open Market Committee, monthly meeting of Federal Reserve regarding monetary policy (setting interest rates)
DOE: US Department of Energy
Uncle Point: or stop loss point, a level at which you’ve clearly been wrong on your position, so cry uncle and get out!