
Sentiment continued to sour on risk markets overnight amid concerns that stimulus pullback is still coming sooner rather than later, despite a disappointing Biege Book reading from the Fed overnight. Wall Street continued with another mild selloff, while European shares dropped sharply across the continent as the USD continued to firm against the major undollar assets. Commodity markets were mixed with oil having a small reversal, while industrial metals, iron ore and gold all fell between 2 and 3%.
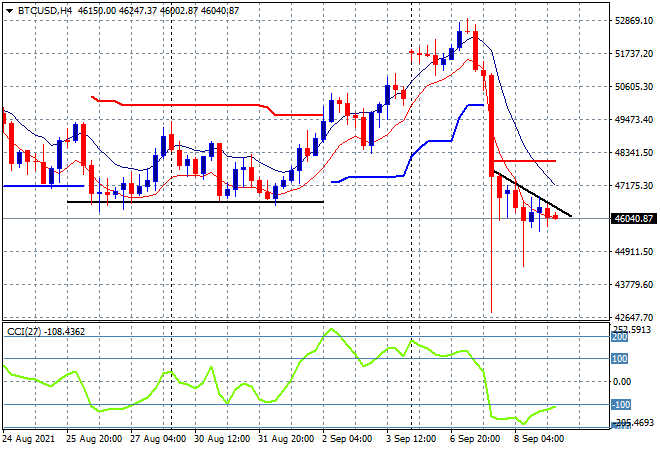
Bitcoin is struggling to find support at just above the $46K level after its recent flash crash/pump and dump from $52 to $42K with the inability to make any new session highs since that 20% instant fall. The four hourly chart shows a descending triangle pattern – for what its worth – that combined with a potential momentum switch is possibly suggesting a bottom maybe in, but I remain extremely cautious here:
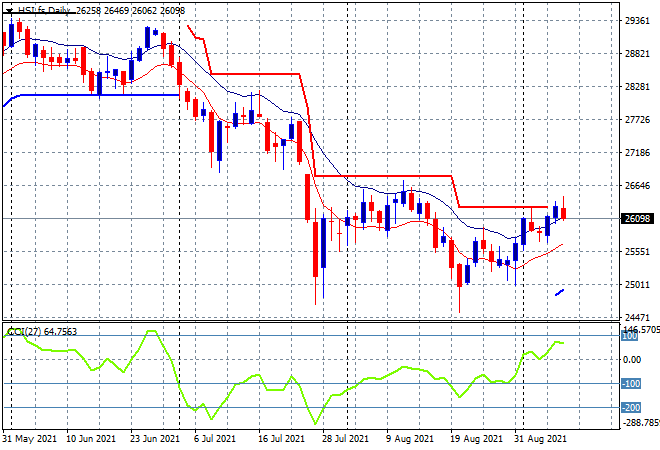
Looking at share markets in Asia from yesterday’s session, where the Shanghai Composite paused its recent surge, finishing flat but still well above the 3600 point level at 3675 points while the Hang Seng Index pulled back further, down 0.2% to 26320 points. The daily chart is showing price trending higher but still struggling to decisively clear its own high moving average, and while momentum is now properly positive its not yet overbought, with trailing ATR resistance above the 26000 point level needing a big clearout:
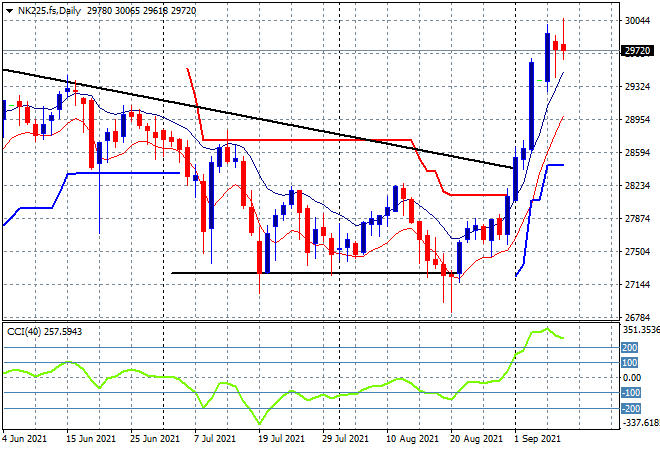
Japanese stocks remained the standout however with the Nikkei 225 finishing 0.9% higher to break above 30000 points, closing at 30181. The daily chart shows price way overextended, and while the 30000 point level is a tempting target, its likely to revert sharply here due to risk correlations finally catching up:
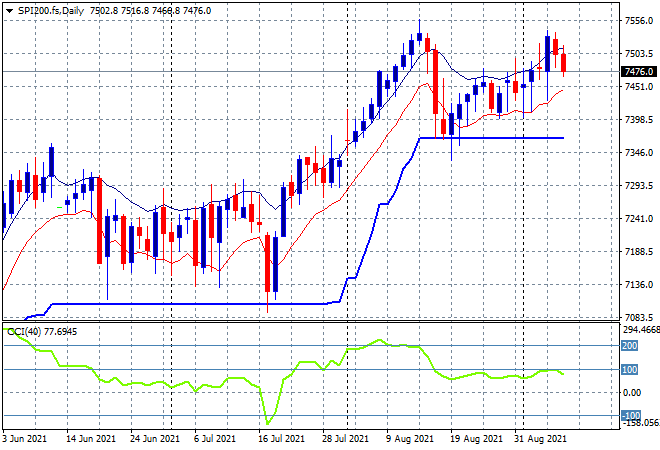
Australian stocks followed Chinese bourses with the ASX200 again down 0.3% to close at just above the 7500 level at 7512 points. SPI futures are down nearly 0.5% on the European selloff with the lower Australian dollar may provide some backstopping however to forestall a proper selloff locally. Price still needs to clear its own high moving average with ATR support very solid at the 7360 point level:
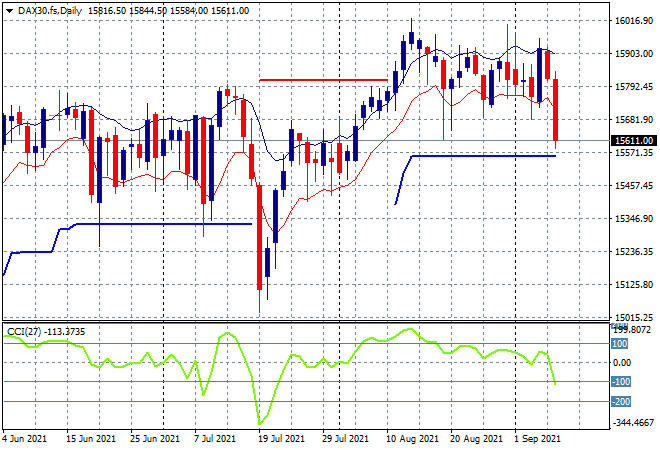
European markets have moved into selloff mode with most losing nearly 1% or so, while the German DAX did even worse, losing 1.5% to finish at 15610 points as a result. The daily chart is quite clear to work out now after frustrating for so long with a breakdown imminent below ATR support at the 15500 point level to make for a quick dip back to the 15000 point level reached in July:
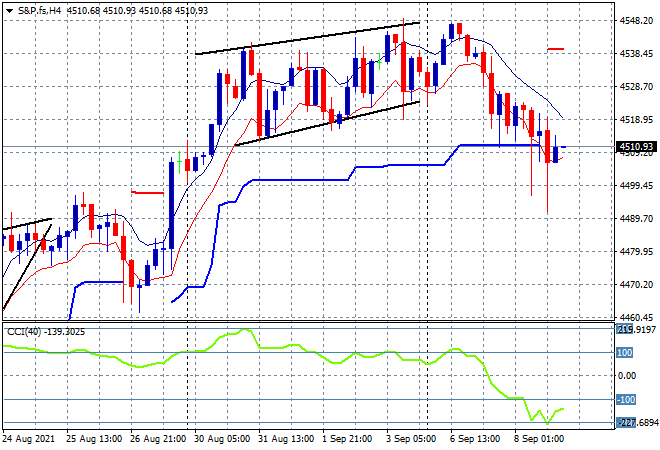
Wall Street didn’t escape the selloff either, although it did relatively better with the S&P500 falling back 0.2% to 4514 points as the NASDAQ did the heavy lifting, finishing nearly 0.6% lower. The four hourly chart of the former shows prices pushing through but still hovering around ATR support at the 4500 point level where I expect the BTFD crowd to step in soon:
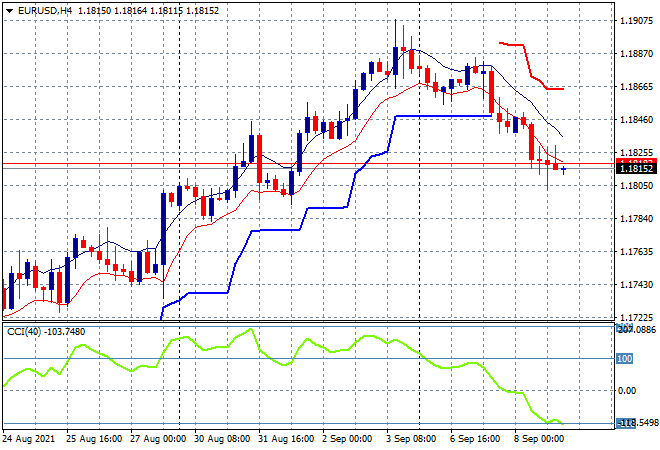
Currency markets remained in USD strong mode in a clear risk aversion trade with Euro still moving lower although trading ranges are getting tighter as it approaches the 1.18 level. Momentum has well and truly inverted from the overbought levels and is now slightly oversold but price deceleration is pointing to a possible bottom here:
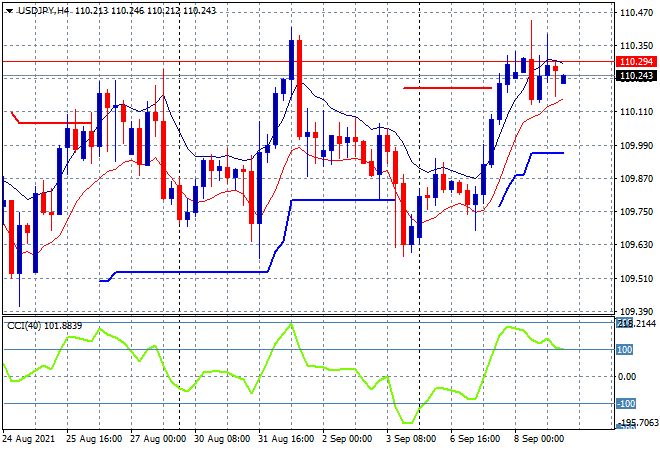
The USDJPY pair has stalled again at the previous weekly high, unable to advance above the 110.30 from last week’s resistance level. Momentum was only slightly overbought and is now retracing so watch the low moving average to come under pressure before another breakdown below the 110 handle:
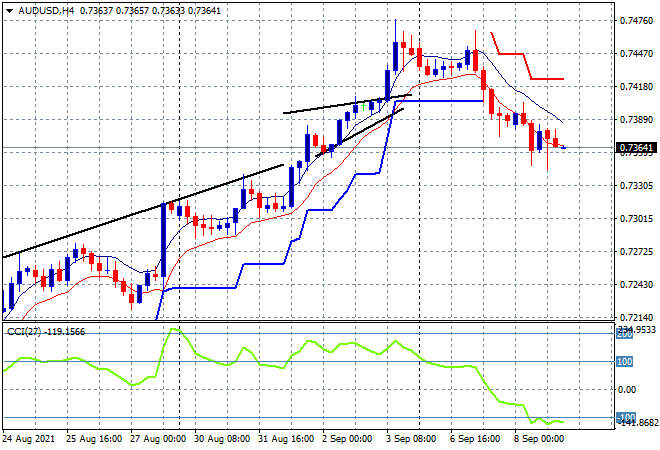
The Australian dollar continued its retracement from the Friday night over extension, almost falling to the mid 73 level overnight. Momentum on the four hourly chart are now in the oversold range, but price action does have a deceleration pattern baked in suggesting that further falls are unlikely. This could go further however if iron ore prices don’t pick up and the USD continues its safe haven bid:
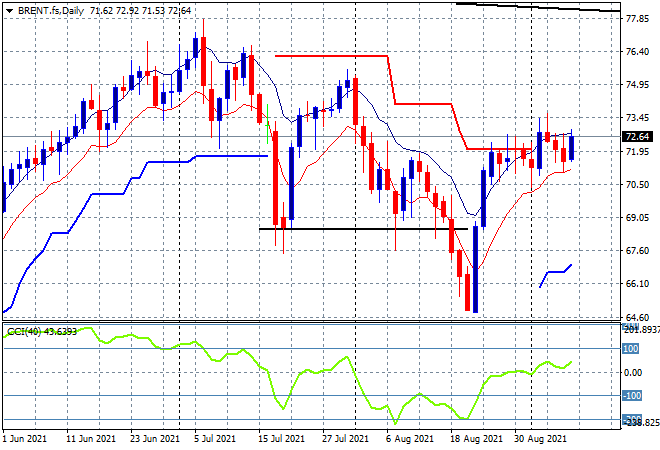
Oil prices got out of their minor retracement mode with Brent crude bouncing back above the $72USD per barrel level but not yet making a new daily high in the last five trading sessions. This keeps price action hovering around the previous trailing ATR resistance level on the daily chart but not yet above the previous daily highs in late July/early August, so watch for daily momentum that has to maintain a positive setting here to have another go at the $75 level ahead:
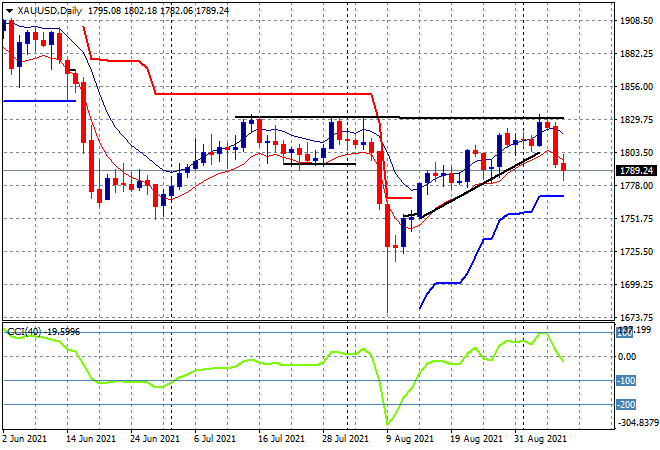
Gold continued its fall below the key $1800USD per ounce psychological level overnight as USD remained strong against all the majors. The rejection of overhead resistance at the $1830 level is quite telling and will likely see more selling going forward so watch for the ATR daily support level to be the target in this pullback:
Glossary of Acronyms and Technical Analysis Terms:
ATR: Average True Range – measures the degree of price volatility averaged over a time period
ATR Support/Resistance: a ratcheting mechanism that follows price below/above a trend, that if breached shows above average volatility
CCI: Commodity Channel Index: a momentum reading that calculates current price away from the statistical mean or “typical” price to indicate overbought (far above the mean) or oversold (far below the mean)
Low/High Moving Average: rolling mean of prices in this case, the low and high for the day/hour which creates a band around the actual price movement
FOMC: Federal Open Market Committee, monthly meeting of Federal Reserve regarding monetary policy (setting interest rates)
DOE: US Department of Energy
Uncle Point: or stop loss point, a level at which you’ve clearly been wrong on your position, so cry uncle and get out!