
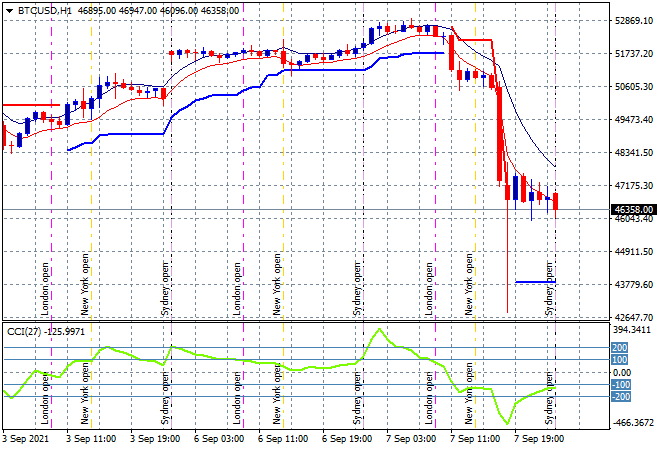
Sentiment is reversing on risk markets amid concerns that slower growth is ahead as the latest German ZEW Survey indicated future economic expectations are flagging across the continent. The return of US traders did not help quell those concerns with Wall Street putting in a poor start to their shorter trading week, while the USD returned to strength against almost everything. Commodity prices saw a general selloff across the board with 1% falls but all the volatility was truly in Bitcoin which had its own flash crash overnight. After gapping well above the $50K level, within 24 hours it had fallen to over 20% to just above the $42K level before recovering (sic) to the $46K level this morning. The hourly chart shows the result – all due to some amazing pump and dump volume trading:
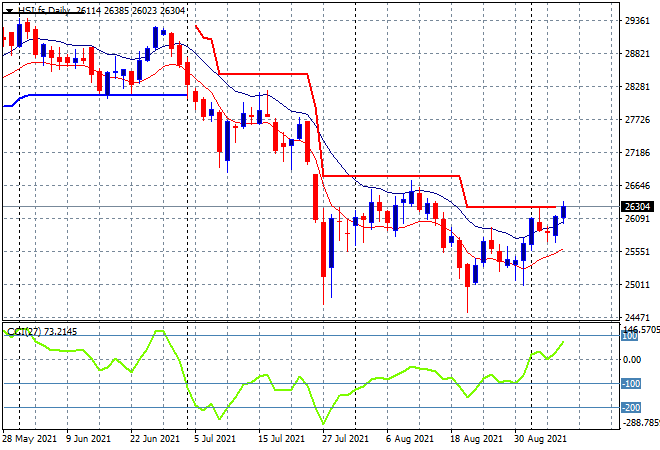
Looking at share markets in Asia from yesterday’s session, where the Shanghai Composite continued its great start to the week, up over 1.5% to climb well above the 3600 point level to close at 3678 points while the Hang Seng Index finished 0.7% higher to extend its own gains above the 26000 point level. The daily chart is now putting in a decent bottom pattern, as price clears its own high moving average, and momentum now properly positive, with trailing ATR resistance above the 26000 point level in the first step of being put aside:
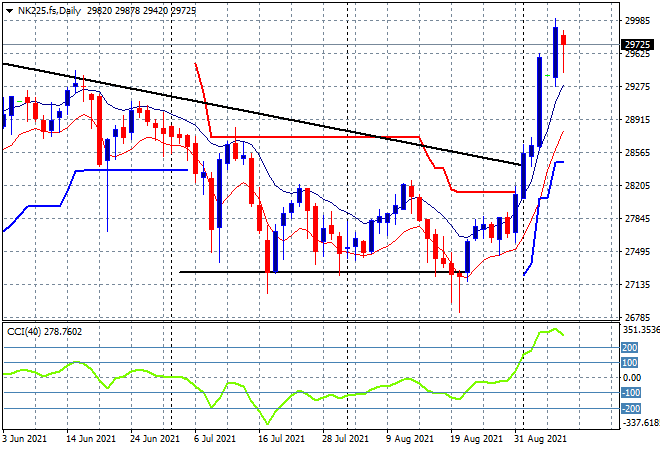
All the positivity remained in Japanese stocks however with the TOPIX putting in multi decade highs while the Nikkei 225 finished 0.9% higher to almost break above 30000 points. The daily chart shows price way overextended, and while the 30000 point level is a tempting target, its likely to revert sharply here due to risk correlations finally catching up. Although the USDJPY surged overnight so the weaker Yen could give it somewhat of a reprieve:
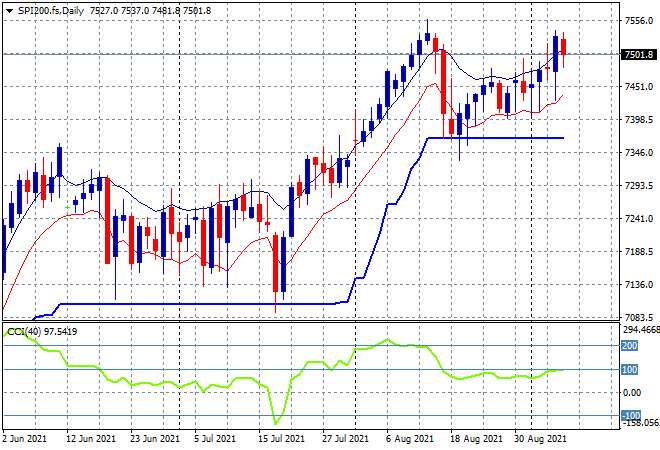
Australian stocks remained the odd ones out with the ASX200 again closing dead flat at 7530 points. SPI futures are down nearly 0.4% which has taken the wind out of the sails for the time being, although a lower Australian dollar may provide a tailwind. The language from the RBA was not that supportive for stocks, its all still dependent on fiscal stimulus with price still needing to clear its own high moving average with ATR support very solid at the 7360 point level:
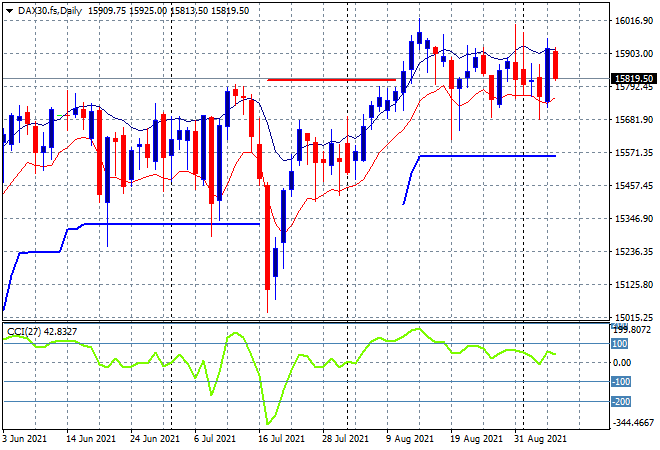
European markets stopped in their tracks with the recent ZEW surveys not helping risk taking as the Eurostoxx pulled back from its multi year high, the German DAX closing 0.5% lower at 15843 points as a result. The daily chart is getting frustrating to discern here with continued failures to make any new daily highs or clearing of the high moving average since early August, as resistance firms at the 16000 point level. Its still hard to be bullish or bearish here as we wait for a catalyst:
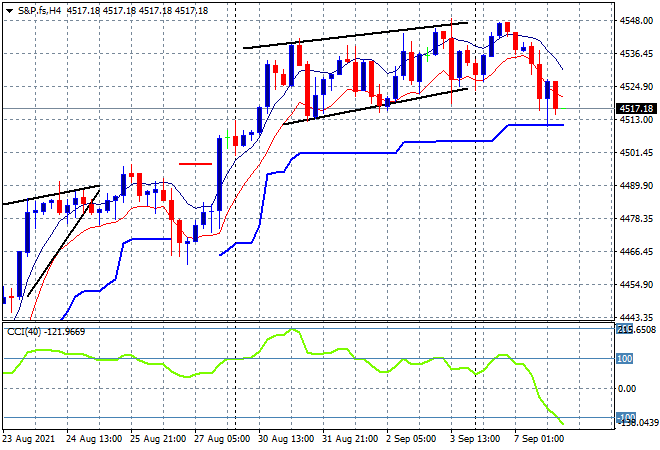
Wall Street returned after the long weekend and concerns over delta COVID helped pullback all but tech stocks with the S&P500 falling back 0.3% to float just above the 4500 point level. The four hourly chart was showing an upward flag pattern with a tight range but that was thwarted overnight as price headed towards ATR support where the BTFD crowd should step in soon:
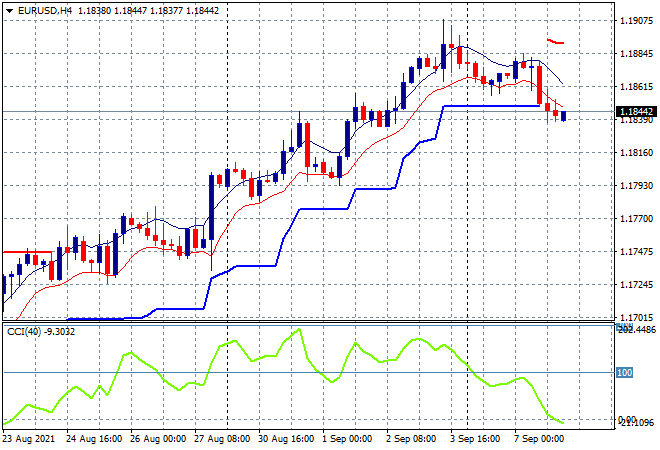
Currency markets finally came back to life with USD strengthening against everything in a clear risk aversion trade with Euro falling straight through its four hourly support to be below the mid 1.18 level. Momentum has inverted from the overbought levels and is nominally neutral so this retracement below trailing ATR support indicates that intrasession resistance at the 1.19 target level is too strong in the short term:
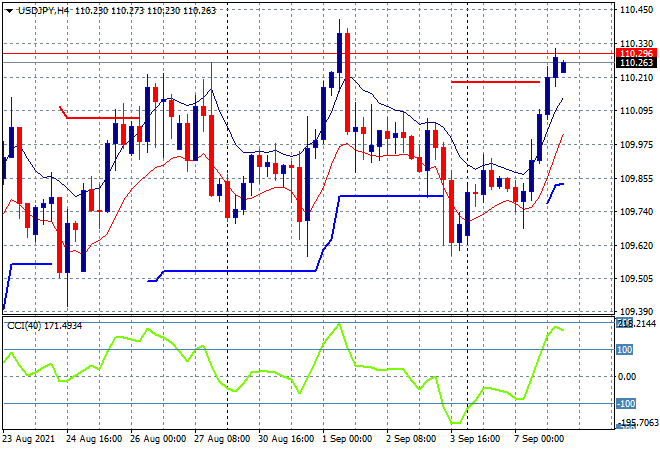
The USDJPY pair was no longer the quiet one, finally catching up to the political turmoil in Japan with consolidation at the 109.80 level turning into a proper brekaout through the 110 handle proper, almost making a new weekly high in the process. Momentum is slightly overdone here so it will be interesting to see what happens in Asian trade today – watch for a possible small reversion on Yen safe haven buying:
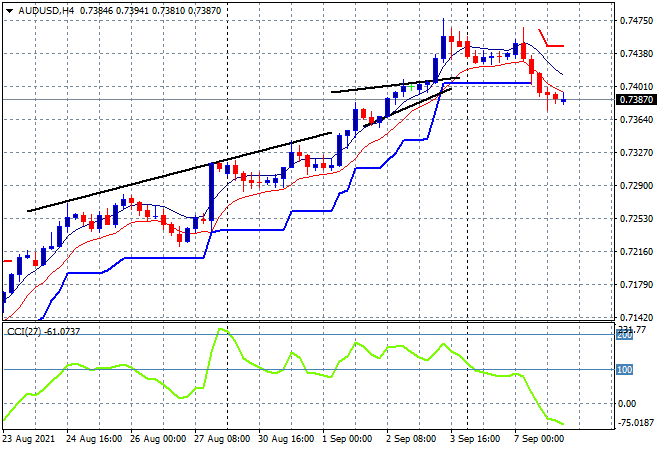
The Australian dollar also fell out of bed and retraced back through its Friday session range to get back below the 74 handle. Momentum readings on the four hourly chart had retraced from their overbought levels with resistance obviously building at the 74.70 level as this extremely over-extended needed this retracement to cool off a bit. Higher iron ore and stronger USD will likely negate any further moves post the RBA meeting, but be careful for another pullback:
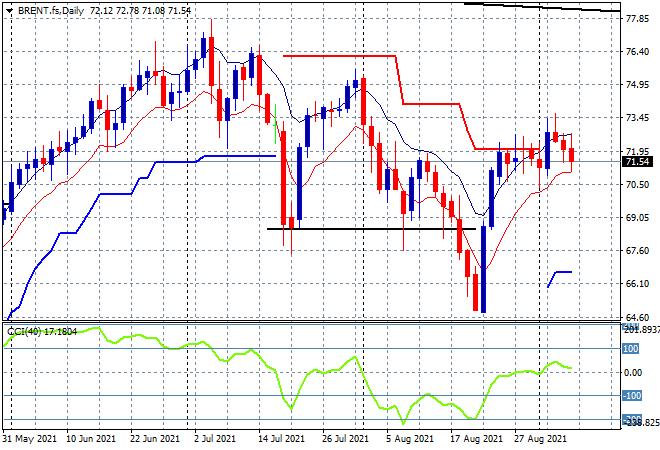
Oil prices are also in a minor retracement mode with Brent crude pulling back below the $72USD per barrel level to continue its tepid start to the trading week. This pulls it back below previous trailing ATR resistance level on the daily chart but not yet above the previous daily highs in late July/early August, so watch for daily momentum that has to maintain a positive setting here to have another go at the $75 level ahead:
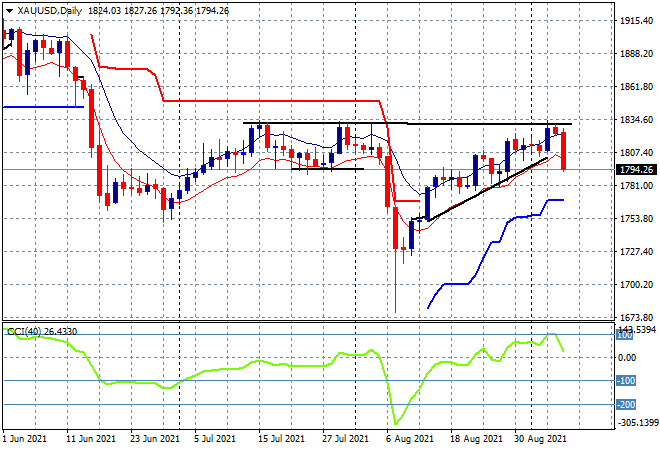
Gold disappointed the most overnight, falling out of its obvious holding pattern as it seemed ready to breakout to new monthly highs above the mid July $1830 highs, instead crumbling below the key $1800USD per ounce psychological level. This will set up a lot of selling going forward so watch for the ATR daily support level to be the target in this pullback:
Glossary of Acronyms and Technical Analysis Terms:
ATR: Average True Range – measures the degree of price volatility averaged over a time period
ATR Support/Resistance: a ratcheting mechanism that follows price below/above a trend, that if breached shows above average volatility
CCI: Commodity Channel Index: a momentum reading that calculates current price away from the statistical mean or “typical” price to indicate overbought (far above the mean) or oversold (far below the mean)
Low/High Moving Average: rolling mean of prices in this case, the low and high for the day/hour which creates a band around the actual price movement
FOMC: Federal Open Market Committee, monthly meeting of Federal Reserve regarding monetary policy (setting interest rates)
DOE: US Department of Energy
Uncle Point: or stop loss point, a level at which you’ve clearly been wrong on your position, so cry uncle and get out!