
The latest US jobs report came and went on Friday night, setting the risk tone for the rest of the month as usual and surprised to the downside – maybe a little too much with another fall in the US ISM Manufacturing survey as well. The USD fell back only slightly while the Australian dollar hit a six week high instead as Treasury yields jumped through the 1.3% barrier again. Commodity prices were mixed with oil down nearly 1%, copper up nearly 1% while gold was able to lift itself up to a near two month high as it builds above the $1800USD per ounce level.
It should be a relatively calm start to the trading week here in Asia with Wall Street not providing a solid lead with all eyes really on bond and currency markets going ahead.
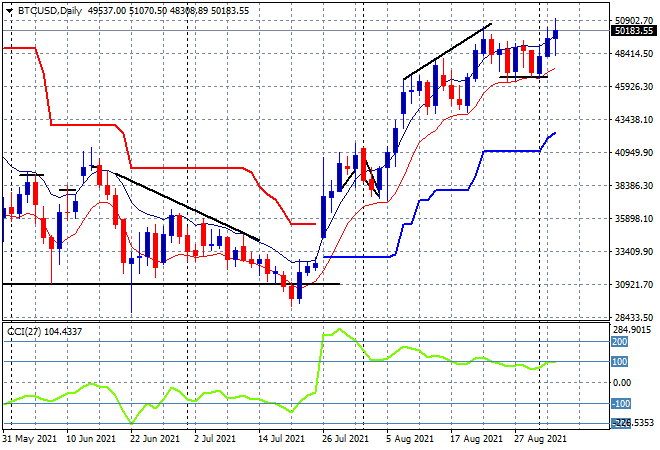
Bitcoin finally lifted through the $50K level after being thwarted most of the week and made a new weekly high, as just below the $51K level on Friday. The daily chart shows a good setup here although momentum is not quite overbought, there is a lot of reflation expectation built in here with support at the $46K level a solid uncle point:
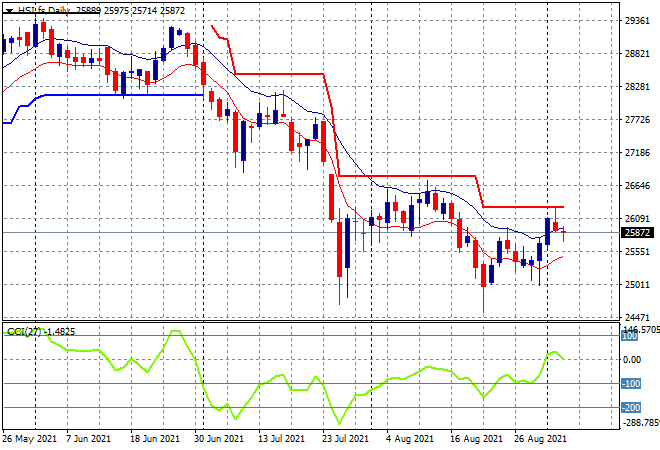
Looking at share markets in Asia from Friday’s session, where the Shanghai Composite struggled to make headway, closing 0.4% lower to break back below the 3600 level at 3581 points at while the Hang Seng Index failed to keep afloat, closing down 0.7% as the 26000 point level turns into resistance. The daily chart is still struggling to put in a bottom pattern, and while price recently cleared its own high moving average, trailing ATR resistance above the 26000 point level continues to weigh heavily on this market. A retracement back towards the low moving average could spell another roundtrip down to 25000:
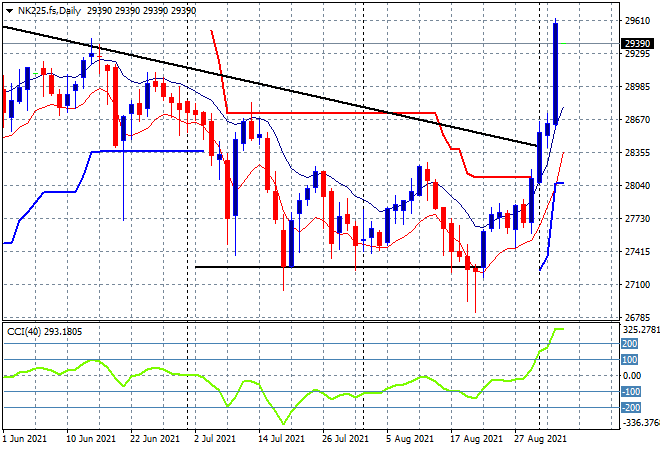
Japanese stocks continued their epic breakout, with the Nikkei 225 finishing more than 2% higher at 29128 points on the back of the PM resigning. The daily chart shows price positively bursting with excitement, having cleared ATR trailing resistance above the 28000 point level and heading inexorably to the 30000 point level instead. The June highs are done and dusted so this will the standout trade to watch this week, with momentum clearly well overbought and overextended, so watch for political catalysts to move things around here:
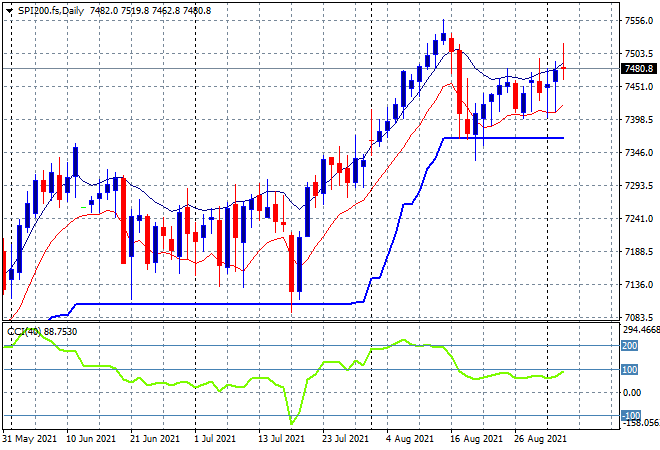
Australian stocks were able to find a little bit more support with the ASX200 closing the week out above the 7500 point level, rising 0.5% to finish at 7522 points. SPI futures however are indicating that most of this will be taken back due to the volatility on Wall Street on Friday night, so we’re likely to see a stalled start to the trading week as price still needs to clear its own high moving average and remain well above ATR support at the 7360 point level:
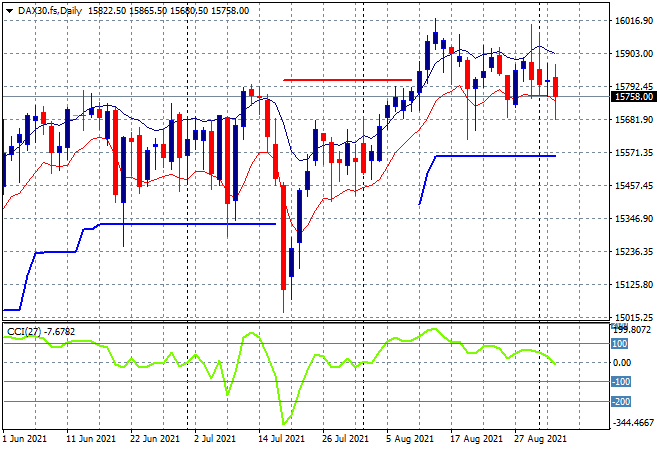
European markets again muddled through but this time the selling was real instead of scratch sessions, with peripheral bourses off by more than 1% and the German DAX closing 0.4% lower at 15781 points. The daily chart is still showing a lot of hesitation with a continued failure to make any new daily highs or clearing of the high moving average since early August, as resistance firms at the 16000 point level. Its hard to be bullish here, but due to strong support at the daily lows above the 15600 point level, only volatility plays will work for now:
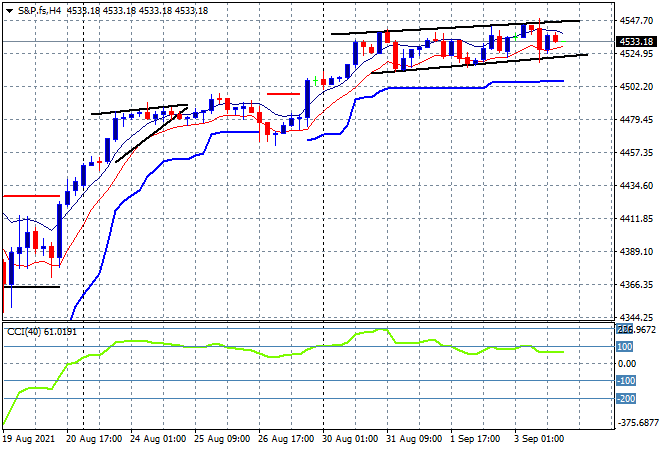
After it was all said and done, only tech stocks advanced on Wall Street with the S&P500 eventually closing 0.2% lower at 4535 points in the wake of the jobs report. The four hourly chart shows an upward flag pattern with a tight range that combined with slightly underbought momentum reading could be pointing to some exhaustion setting in. Indeed ATR support at the 4500 level hasn’t really firmed up last week, but any dip is still likely to be filled by the BTFD crowd as this market remains a short sellers graveyard:
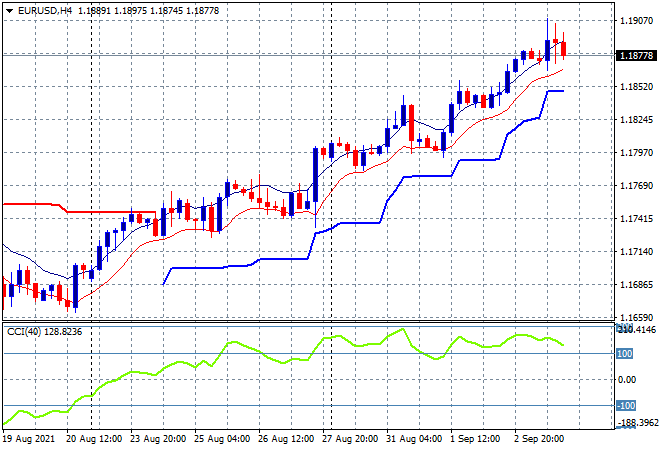
Currency markets saw a continued weakness in USD following the job print with Euro extending its gains slightly, continuing the surge towards the 1.19 handle. Momentum remains nicely overbought here and ready for another leg higher, but some intrasession resistance is building just below the 1.19 target level so I’m watching for a potential pullback as we start the trading week:
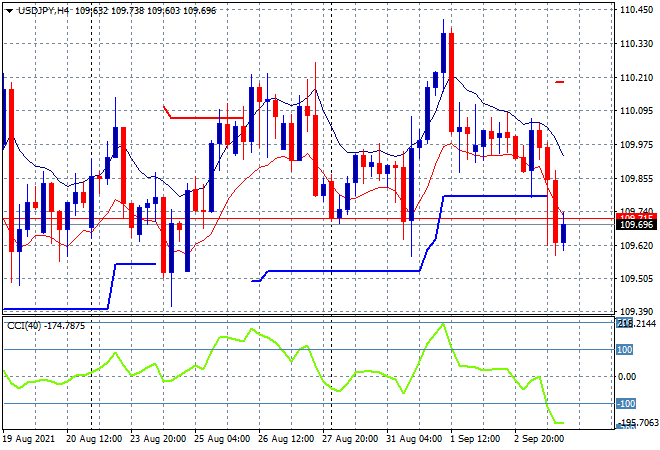
The USDJPY pair was sold off much more swiftly, breaking below short term support that had held from mid week at the 109.80 level for a slightly lower new weekly low. The mid week failed breakout is paying dividends here as a large divergence is occuring between the fortunes of Yen and Japanese stocks as the normal correlation flips. Watch for the 109.50 level at recent weekly support to possible come under pressure next:
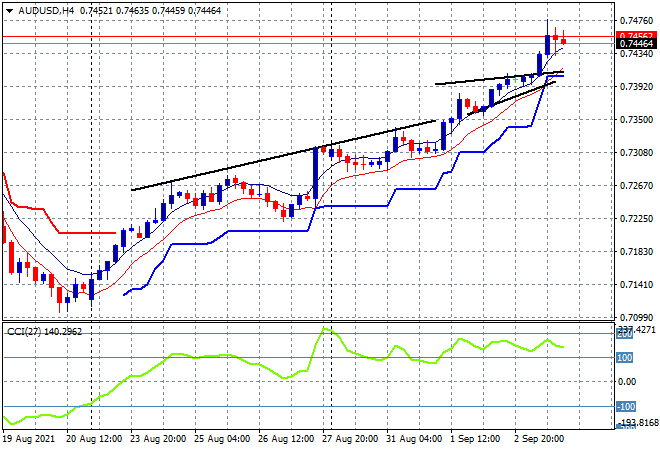
The Australian dollar broke out of its upwards surge upward on the NFP print, after previously rising above the bullish trendline, almost finishing the week at the mid 74 level, now a six week high. While momentum remains nicely overbought on the four hourly chart, intrasession resistance is obviously building as this gets way over-extended. Iron ore and weak USD remain the dual catalysts but how long can it last before another pullback:
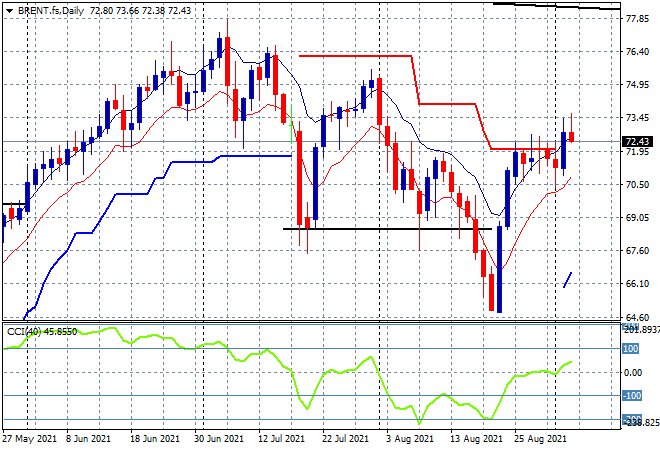
Oil prices are slowly pushing higher after getting some headway midweek with Brent crude pushing 1% higher on Friday night to finish above the $72USD per barrel level. This keeps it back above key overhead trailing ATR resistance level on the daily chart but not yet above the previous daily highs in late July/early August, so watch for daily momentum to build from here and have another go at the $75 level ahead:
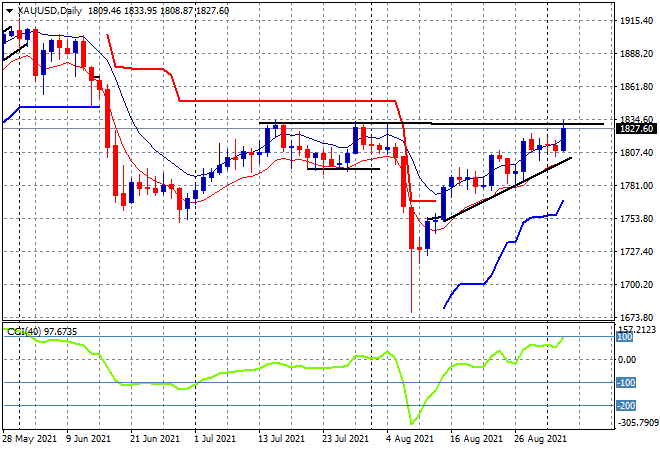
Gold was in an obvious holding pattern waiting for the US jobs report and was able to almost crack through the mid July $1830 highs on the weaker than expected print, setting up for what could be a big next stage rally. Watch for that resistance level if its set aside as the short moves from early August will pile in and send it straight back to $1900:
Glossary of Acronyms and Technical Analysis Terms:
ATR: Average True Range – measures the degree of price volatility averaged over a time period
ATR Support/Resistance: a ratcheting mechanism that follows price below/above a trend, that if breached shows above average volatility
CCI: Commodity Channel Index: a momentum reading that calculates current price away from the statistical mean or “typical” price to indicate overbought (far above the mean) or oversold (far below the mean)
Low/High Moving Average: rolling mean of prices in this case, the low and high for the day/hour which creates a band around the actual price movement
FOMC: Federal Open Market Committee, monthly meeting of Federal Reserve regarding monetary policy (setting interest rates)
DOE: US Department of Energy
Uncle Point: or stop loss point, a level at which you’ve clearly been wrong on your position, so cry uncle and get out!