
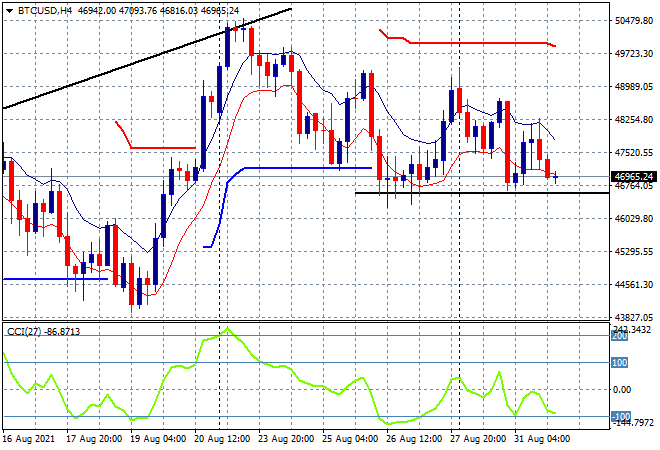
Stock markets had a minor pause overnight due to a surprise upside print in European inflation and subsequent more talk about tapering QE while Wall Street absorbed a big fall in Chicago PMI print. Risk currencies and gold pulled back slightly, the former keeping well above the $1800USD per ounce level as USD remained relatively weak while Treasury yields lifted back to a near weekly high. Bitcoin deflated again, after rejecting yet again a series of higher highs to break below the $47K level and ready to break below support here on the four hourly chart:
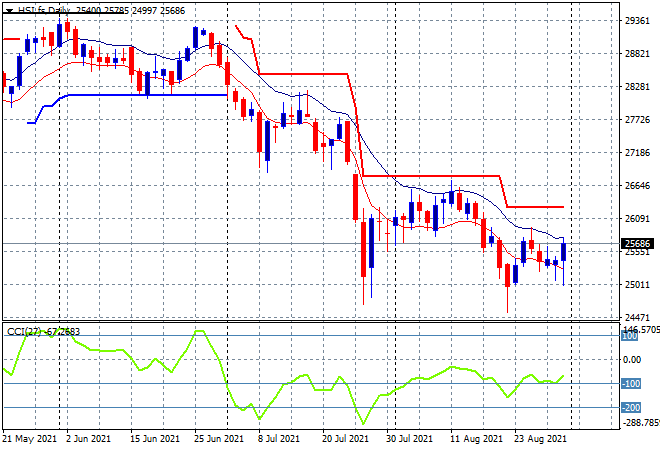
Looking at share markets in Asia from yesterday’s session, where the Shanghai Composite managed to push significantly above the 3500 point level, closing 0.4% higher at 3543 points while the Hang Seng Index did much better, finishing 1.3% higher at 25878 points. The daily chart is trying once more to put in a bottom pattern, but price is still unable to clear its own high moving average or go anywhere near trailing ATR resistance above the 26000 point level, so while support at 25000 points seems quite solid, there is still more potential for more downside here:
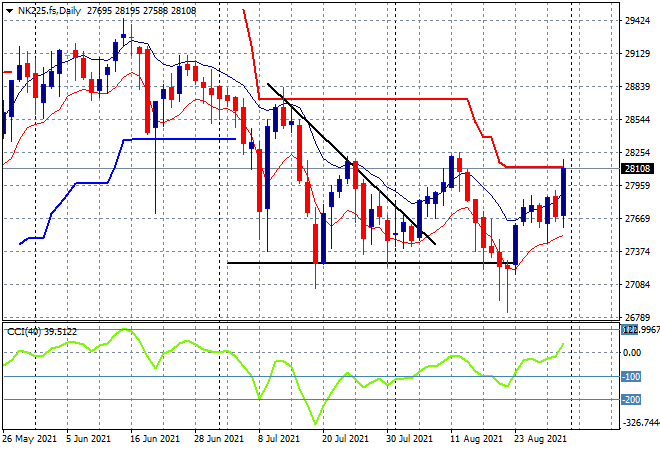
Japanese stocks joined in with the bullish mood, with the Nikkei 225 finishing over 1% higher to close at 28089 points, transforming the previous swing long play into something with more potential. The daily pattern is similar to Chinese stocks, but has much more upside potential, with price almost clearing ATR trailing resistance above the 28000 point level. Futures are indicating a good start to the session with daily momentum finally in the positive zone:
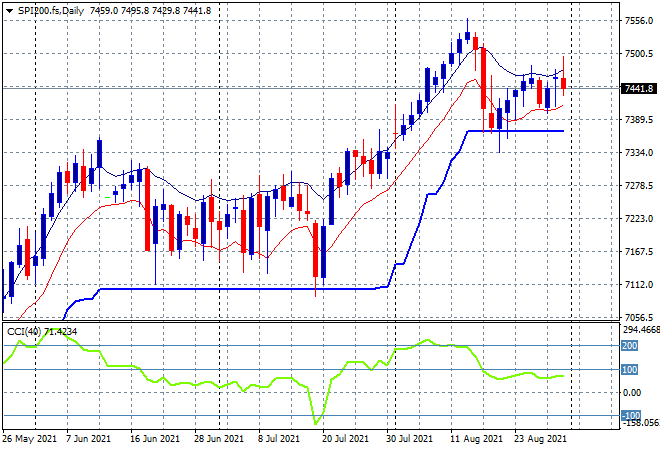
Australian stocks were the relative poor performers, with the ASX200 closing only 0.4% higher to advance further above the 7500 point level at 7534 points. SPI futures however are showing a reversal of this good fortune and possibly more, down 40 points so far in response to the pause on Wall Street overnight. The daily chart still looking tenuous here in a tight band of resistance and support as price needs to clear its own high moving average and remain well above ATR support at the 7360 point level:
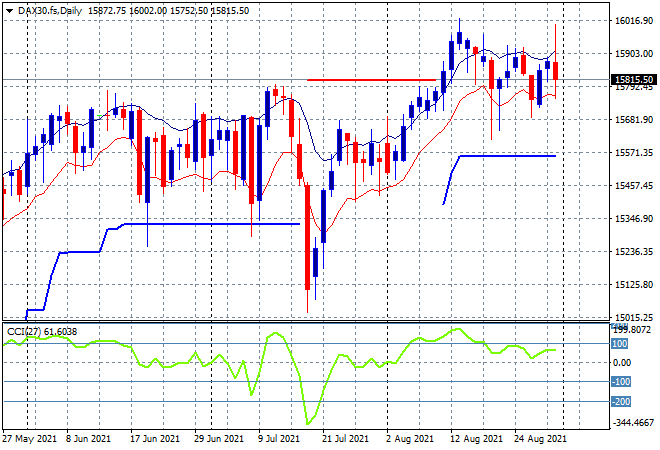
European markets all pulled back in unison as more talk of QE tapering kept risk appetites contained with the German DAX closing 0.3% lower at 15835 points. The daily chart is still showing hesitation with a continued failure to make any new daily highs or clearing of the high moving average since early August, with resistance firming at the 16000 point level. While there has been some evidence of intrasession buying support (note the long tails under the recent daily candles) this may not be enough to stave off a wider dip:
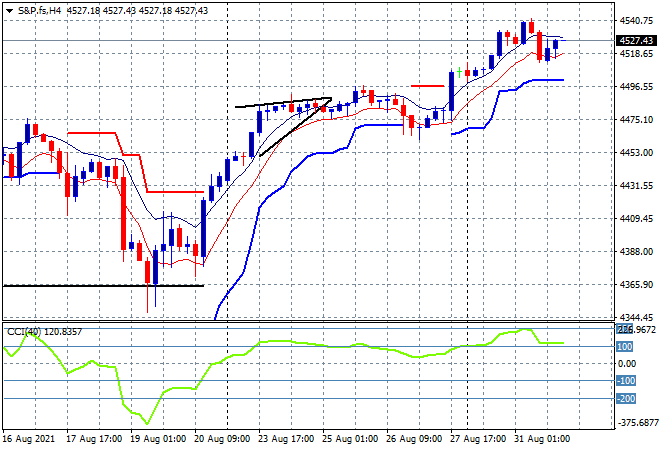
Wall Street all put in minor scratch sessions with the NASDAQ and S&P500 finishing about 0.1% lower each, the latter still well above the 4500 point level to close at 4522 points. The four hourly chart shows prices twirling ever higher to freedom with this only a minor pause to more upside. With very strong ATR support and momentum nicely overbought, the 5000 point level remains the upside target here until the Fed taps the brakes:
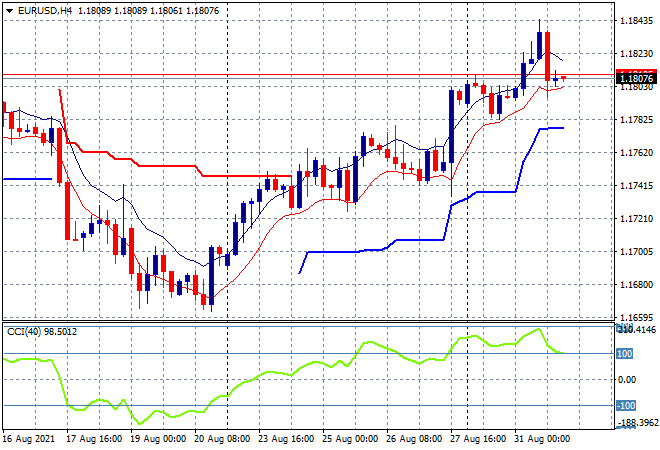
Currency markets saw only a small rollover in USD weakness with Euro the biggest mover, pulling back towards the 1.18 handle, but still continuing its reflation rally. This small retracement was required to keep this going so expect a bounce from the 1.18 handle proper or at worst a further dip to trailing ATR support at the 1.1780 level:
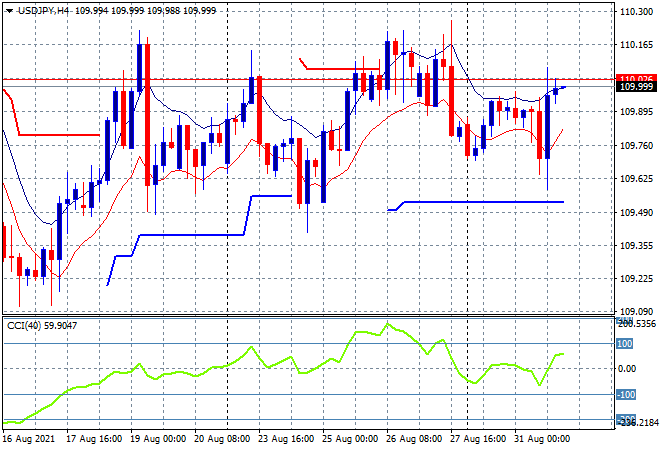
The USDJPY pair had a wide ranging session, pushed down to the mid 109 level before rallying and heading back up to a new intraweek high at just on the 110 handle proper. This remains a hesitant sideways pattern for the last couple of weeks and will require a solid move above the 110.20 level at least to get things moving:
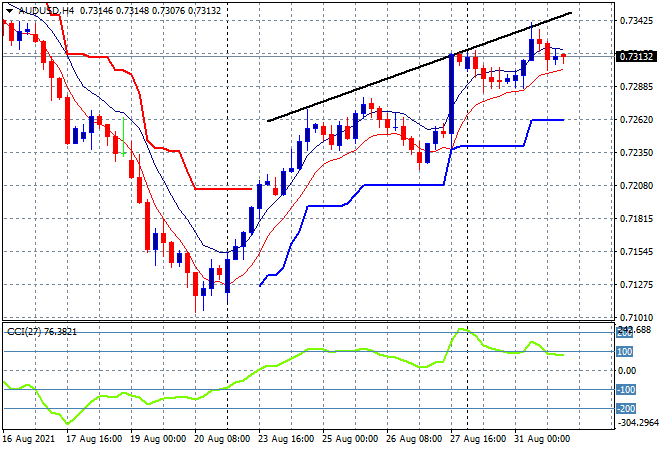
The Australian dollar was relatively quiet overnight, retracing back about half of its previous 24 hours of upside action and still remains nicely above the 73 handle and on trend. The 73.80 level is still the next upside target so watch for a bounce above the low moving average here on the four hourly chart with today’s GDP print a possible catalyst:
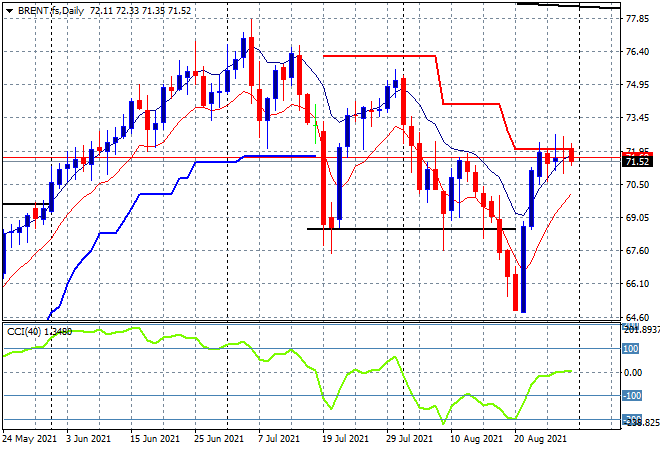
Oil prices are trying to steady here following the reflation trade on the swing below the $69 level for Brent crude which settled where it started at the mid $71USD per barrel level overnight, still unable to make a new daily high. This keeps it just below the key overhead trailing ATR resistance level on the daily chart and well below the previous daily highs in late July/early August, so watch for daily momentum that needs to exceed this neutral setting for more upside:
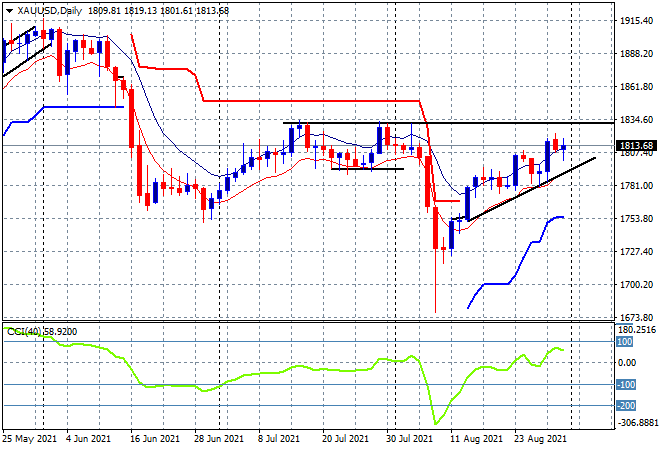
Gold continues to have a much clearer path here above the key $1800USD per ounce level, re-engaging short and medium term momentum as it puts in a solid session overnight to finish just below the $1814 level. While previous resistance has been pushed aside, the question still remains if it can make it back to the mid July $1830 highs as daily momentum needs to exceed overbought levels for a proper rally:
Glossary of Acronyms and Technical Analysis Terms:
ATR: Average True Range – measures the degree of price volatility averaged over a time period
ATR Support/Resistance: a ratcheting mechanism that follows price below/above a trend, that if breached shows above average volatility
CCI: Commodity Channel Index: a momentum reading that calculates current price away from the statistical mean or “typical” price to indicate overbought (far above the mean) or oversold (far below the mean)
Low/High Moving Average: rolling mean of prices in this case, the low and high for the day/hour which creates a band around the actual price movement
FOMC: Federal Open Market Committee, monthly meeting of Federal Reserve regarding monetary policy (setting interest rates)
DOE: US Department of Energy
Uncle Point: or stop loss point, a level at which you’ve clearly been wrong on your position, so cry uncle and get out!