
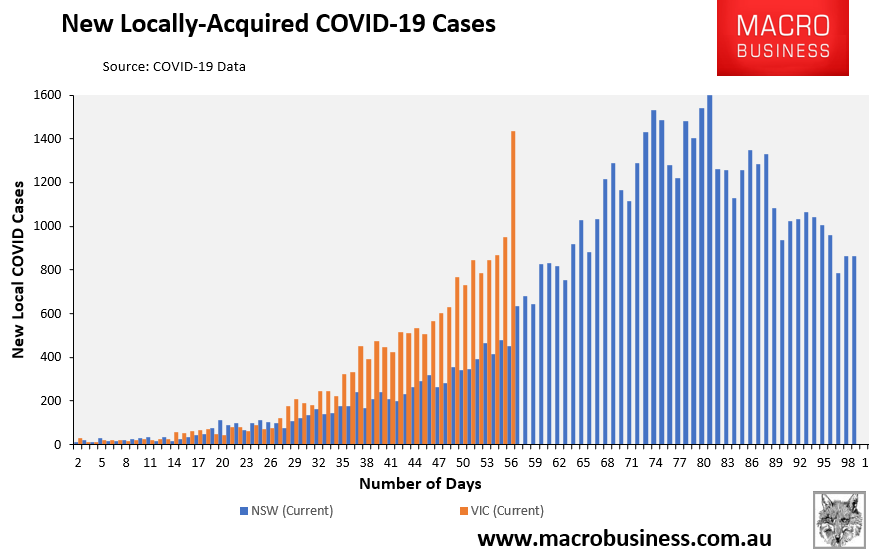
As reported earlier, Victoria today recorded a whopping 1438 new locally acquired COVID cases – an increase of nearly 500 from the prior day and easily surpassing NSW:
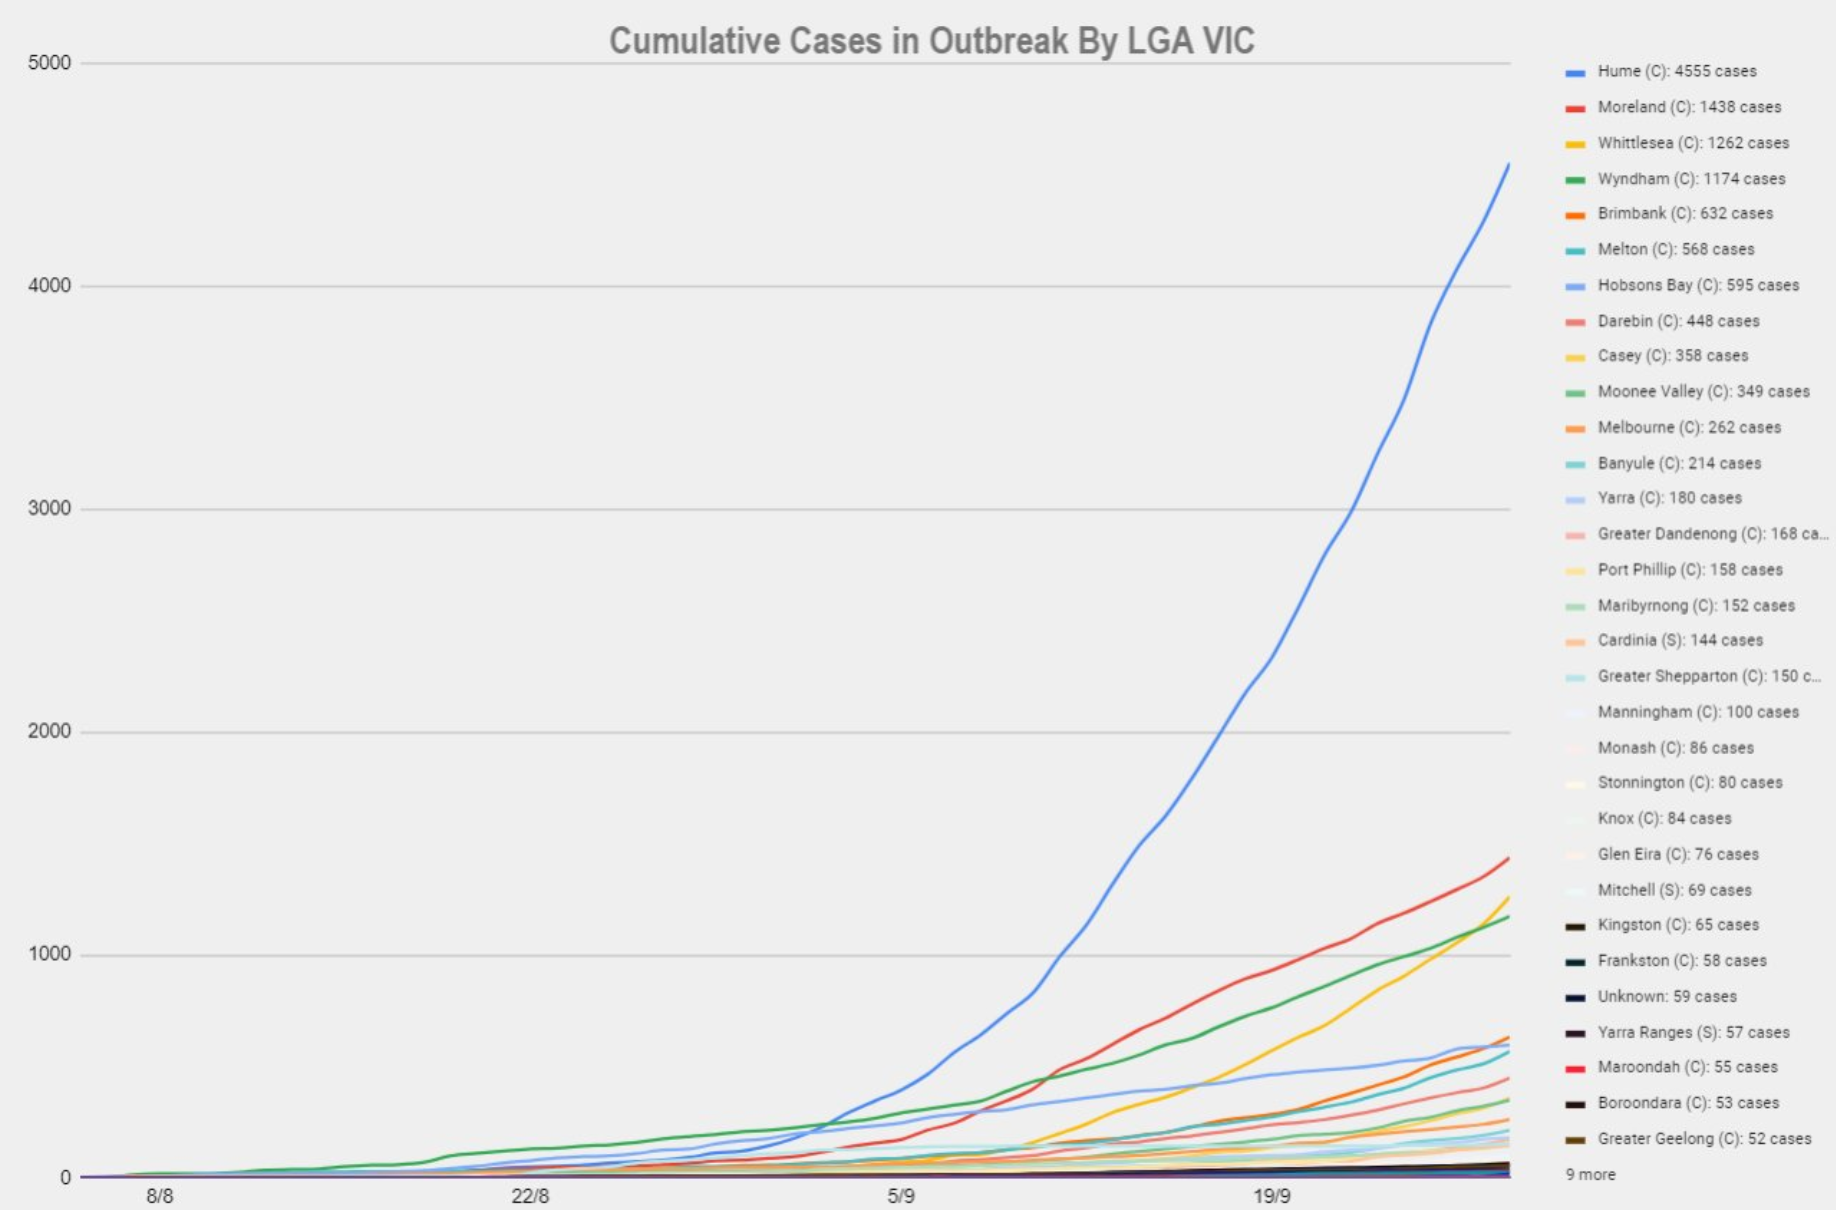
The boys at COVIDBaseAU have done a terrific job deconstructing the data, which shows that LGAs in Melbourne’s North and West continue to drive the cases (I live in Boroondara, which has only 53 cases):
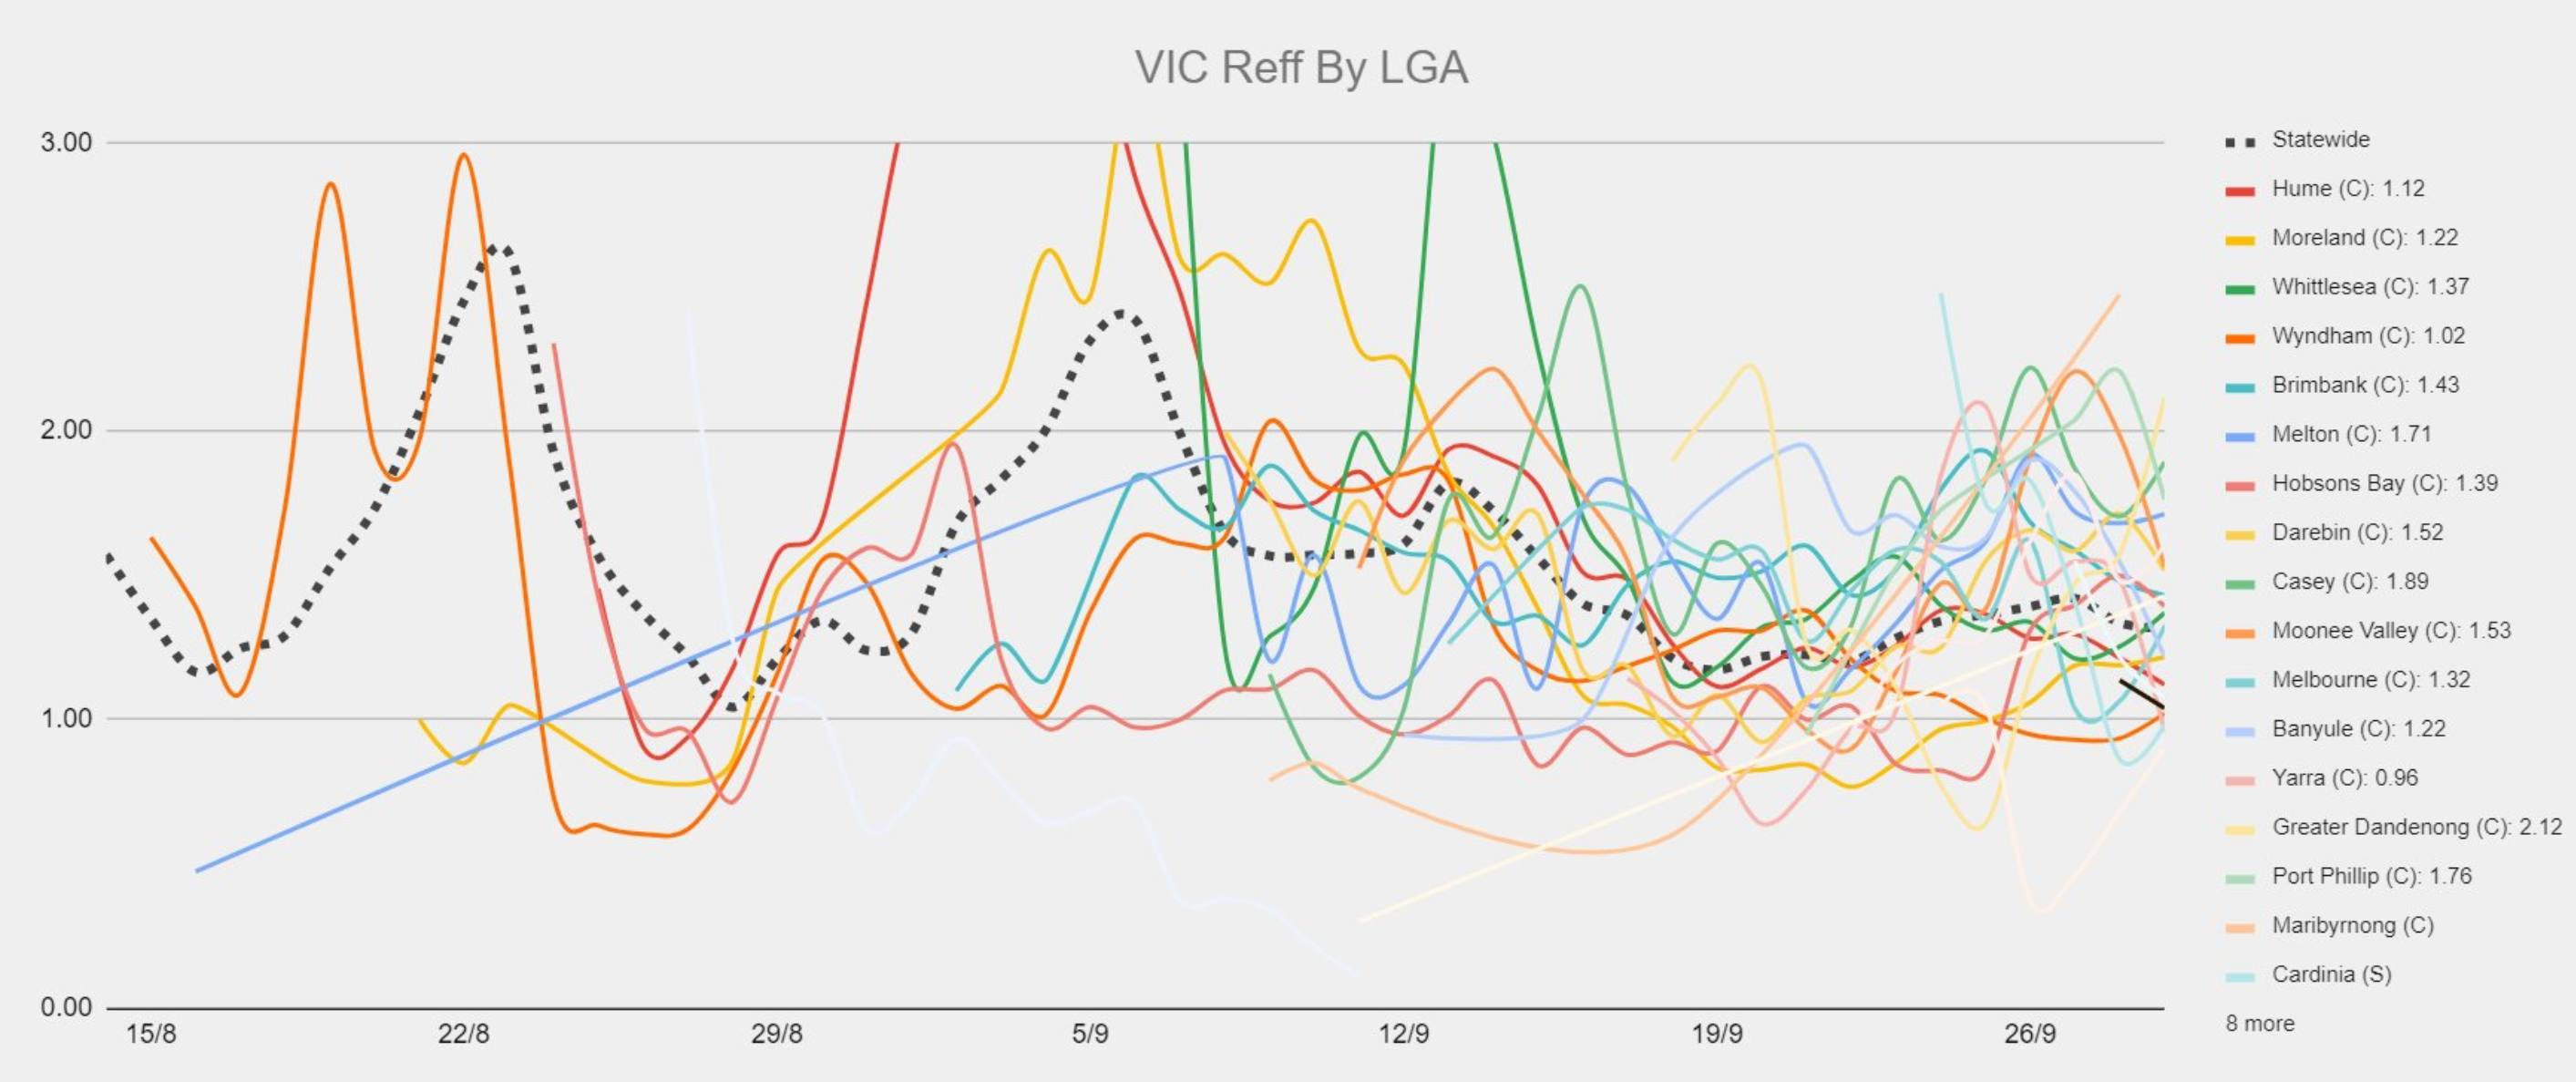
The next chart plots the Reff across LGAs, where a Reff > 1 means cases will rise. Victoria’s total Reff is 1.37:
The next chart plots the cases and Reff by region:
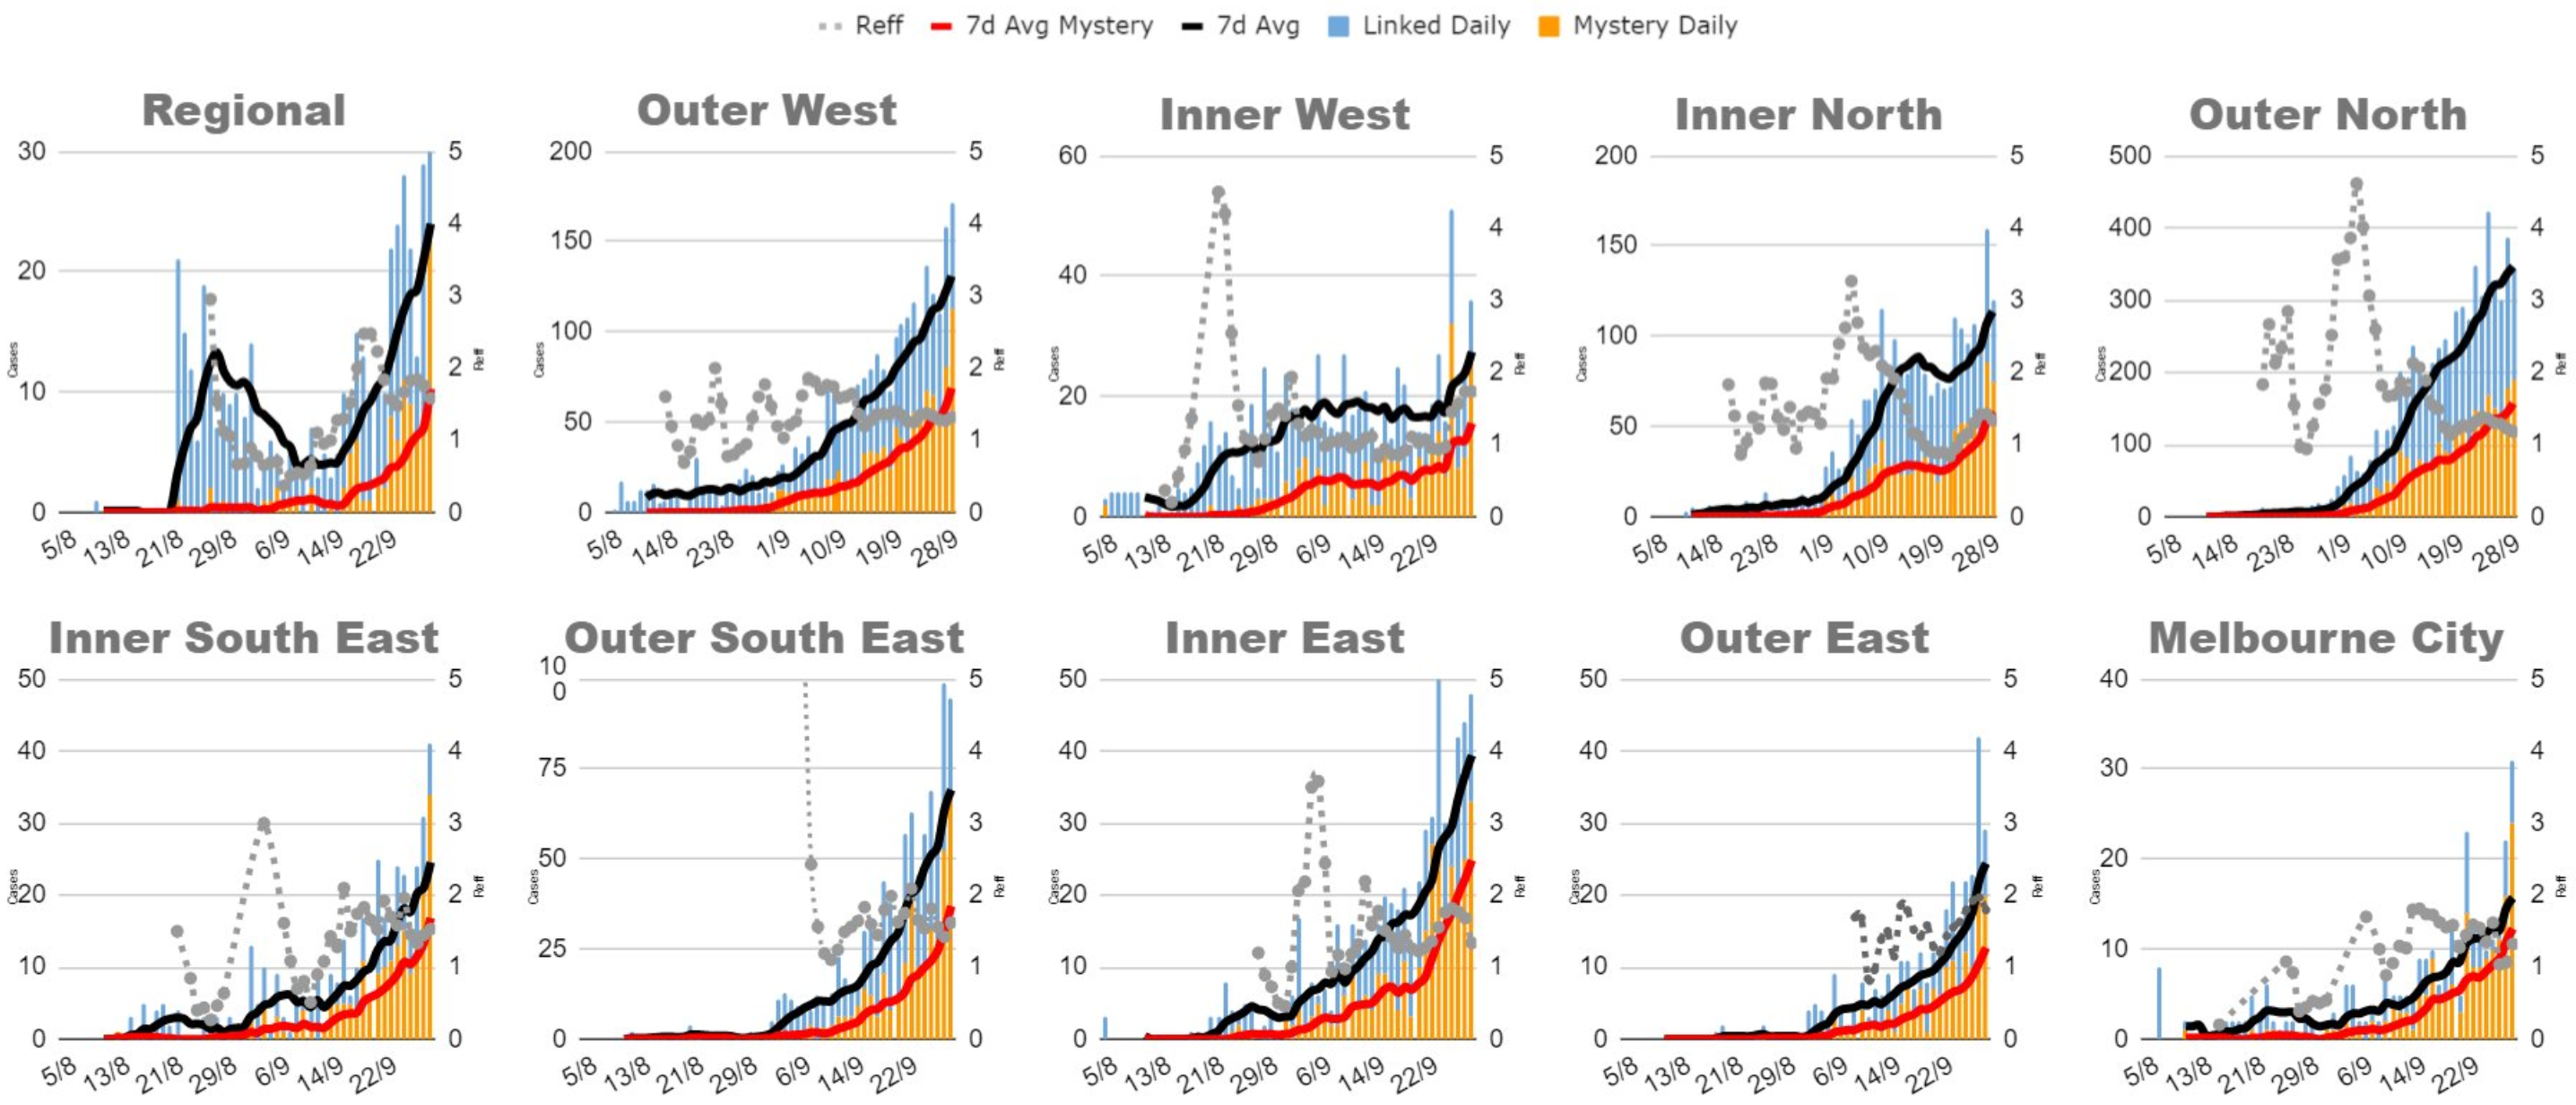
The share of cases in past 14 days are as follows:
- Regional VIC: 2.60%
- Outer West: 16.28%
- Outer North: 44.29%
- Inner North: 14.06%
- Inner South East: 2.82%
- Outer East: 2.59%
- Inner East: 4.42%
- Inner West: 3.26%
- Melbourne City: 1.94%
- Outer South East: 7.74%
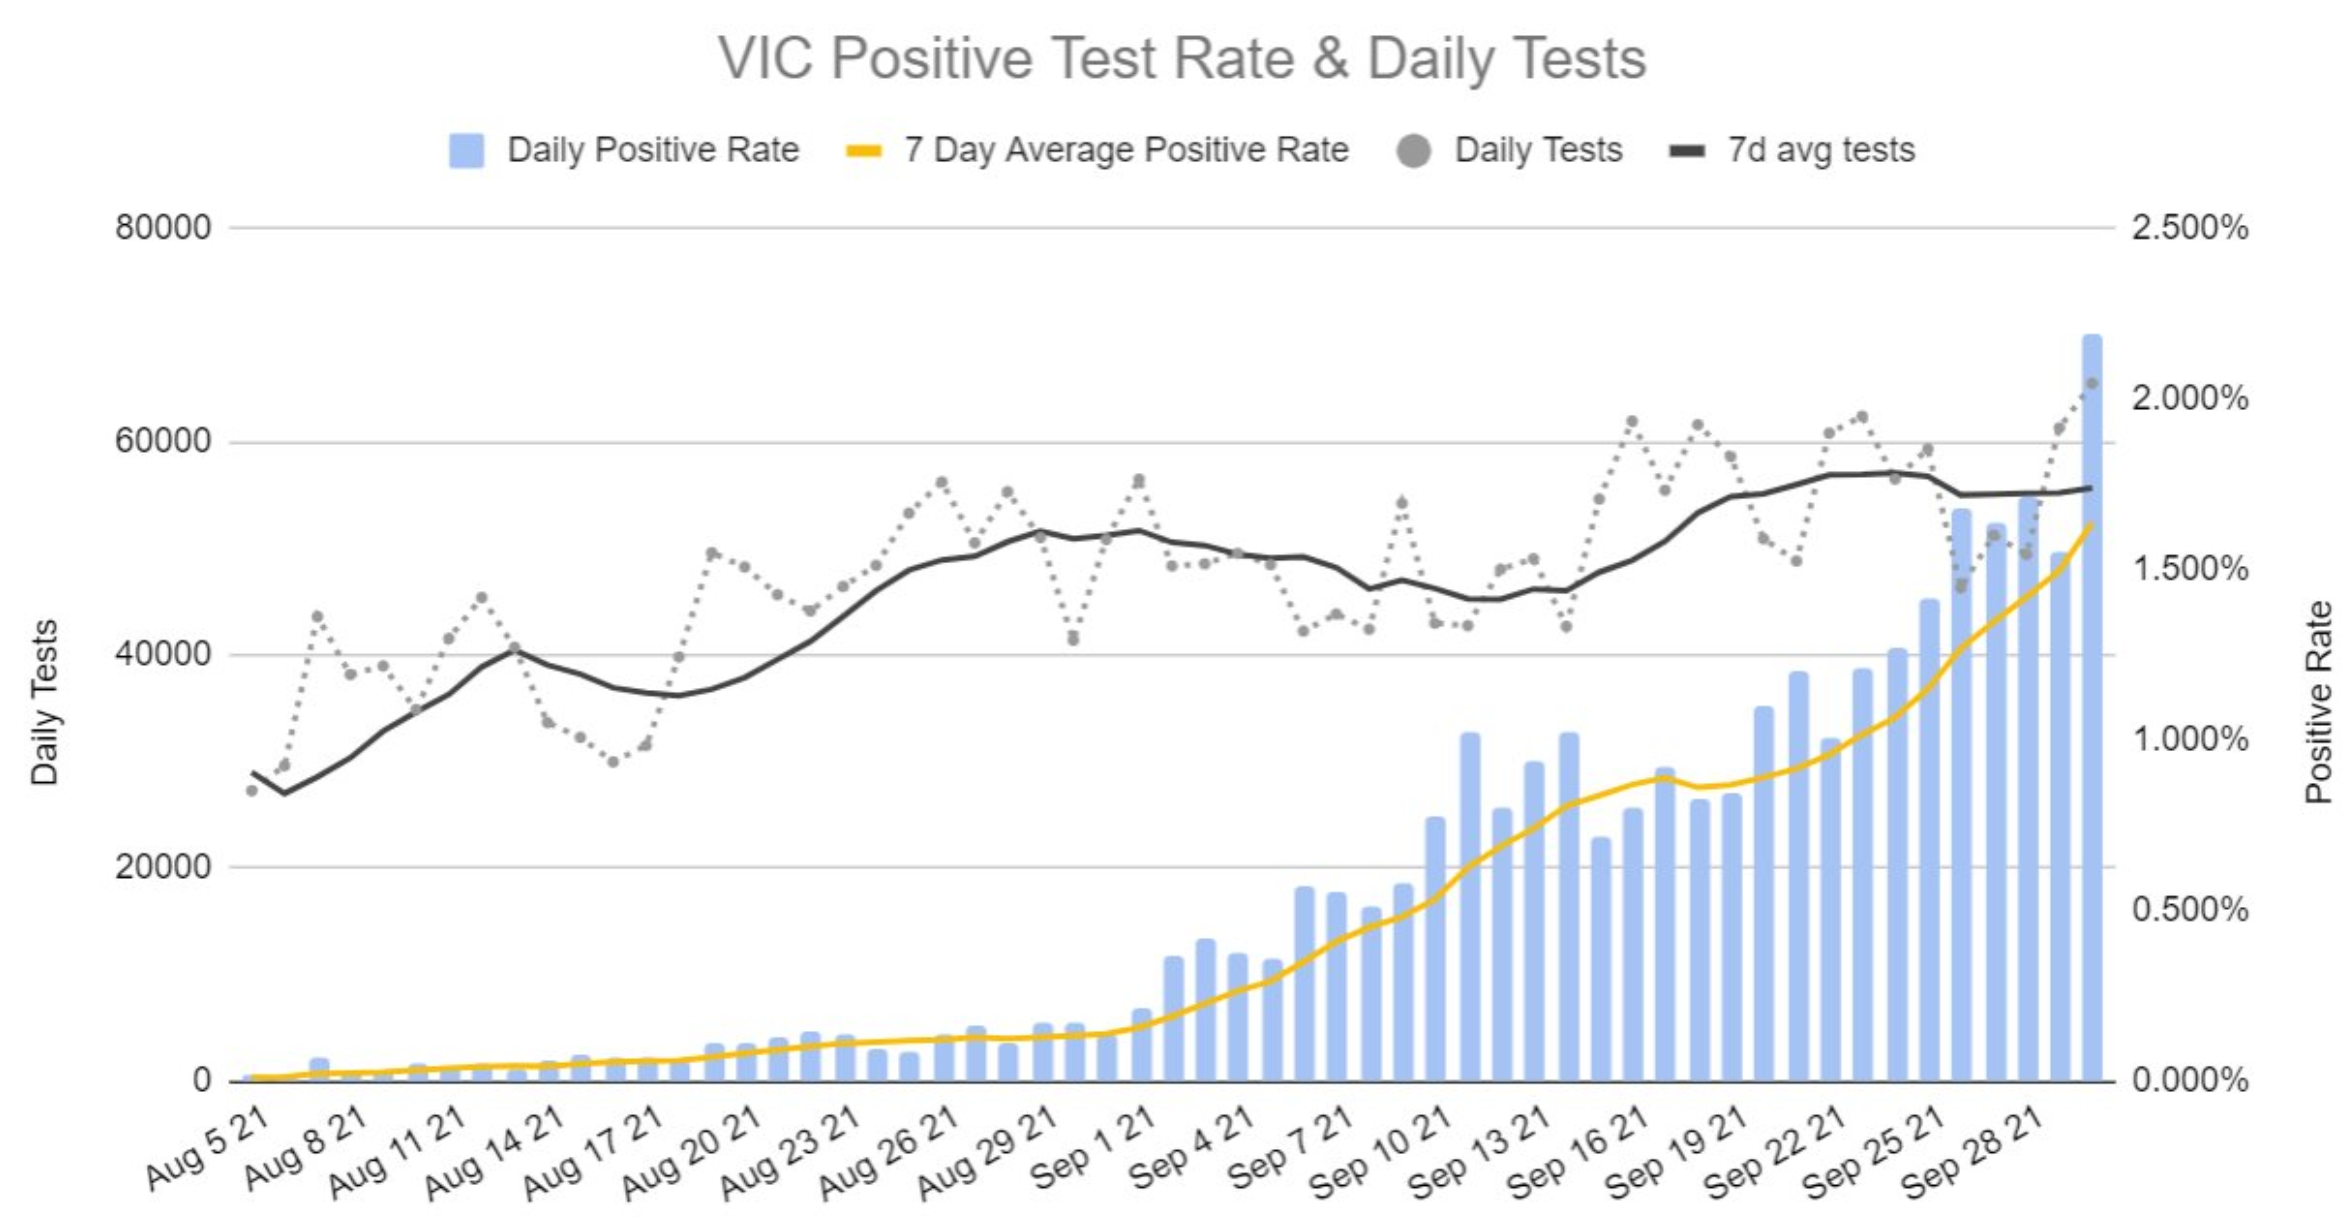
Finally, 2.2% of the tests reported in Victoria over the past 24 hours returned a positive result – a pandemic high:
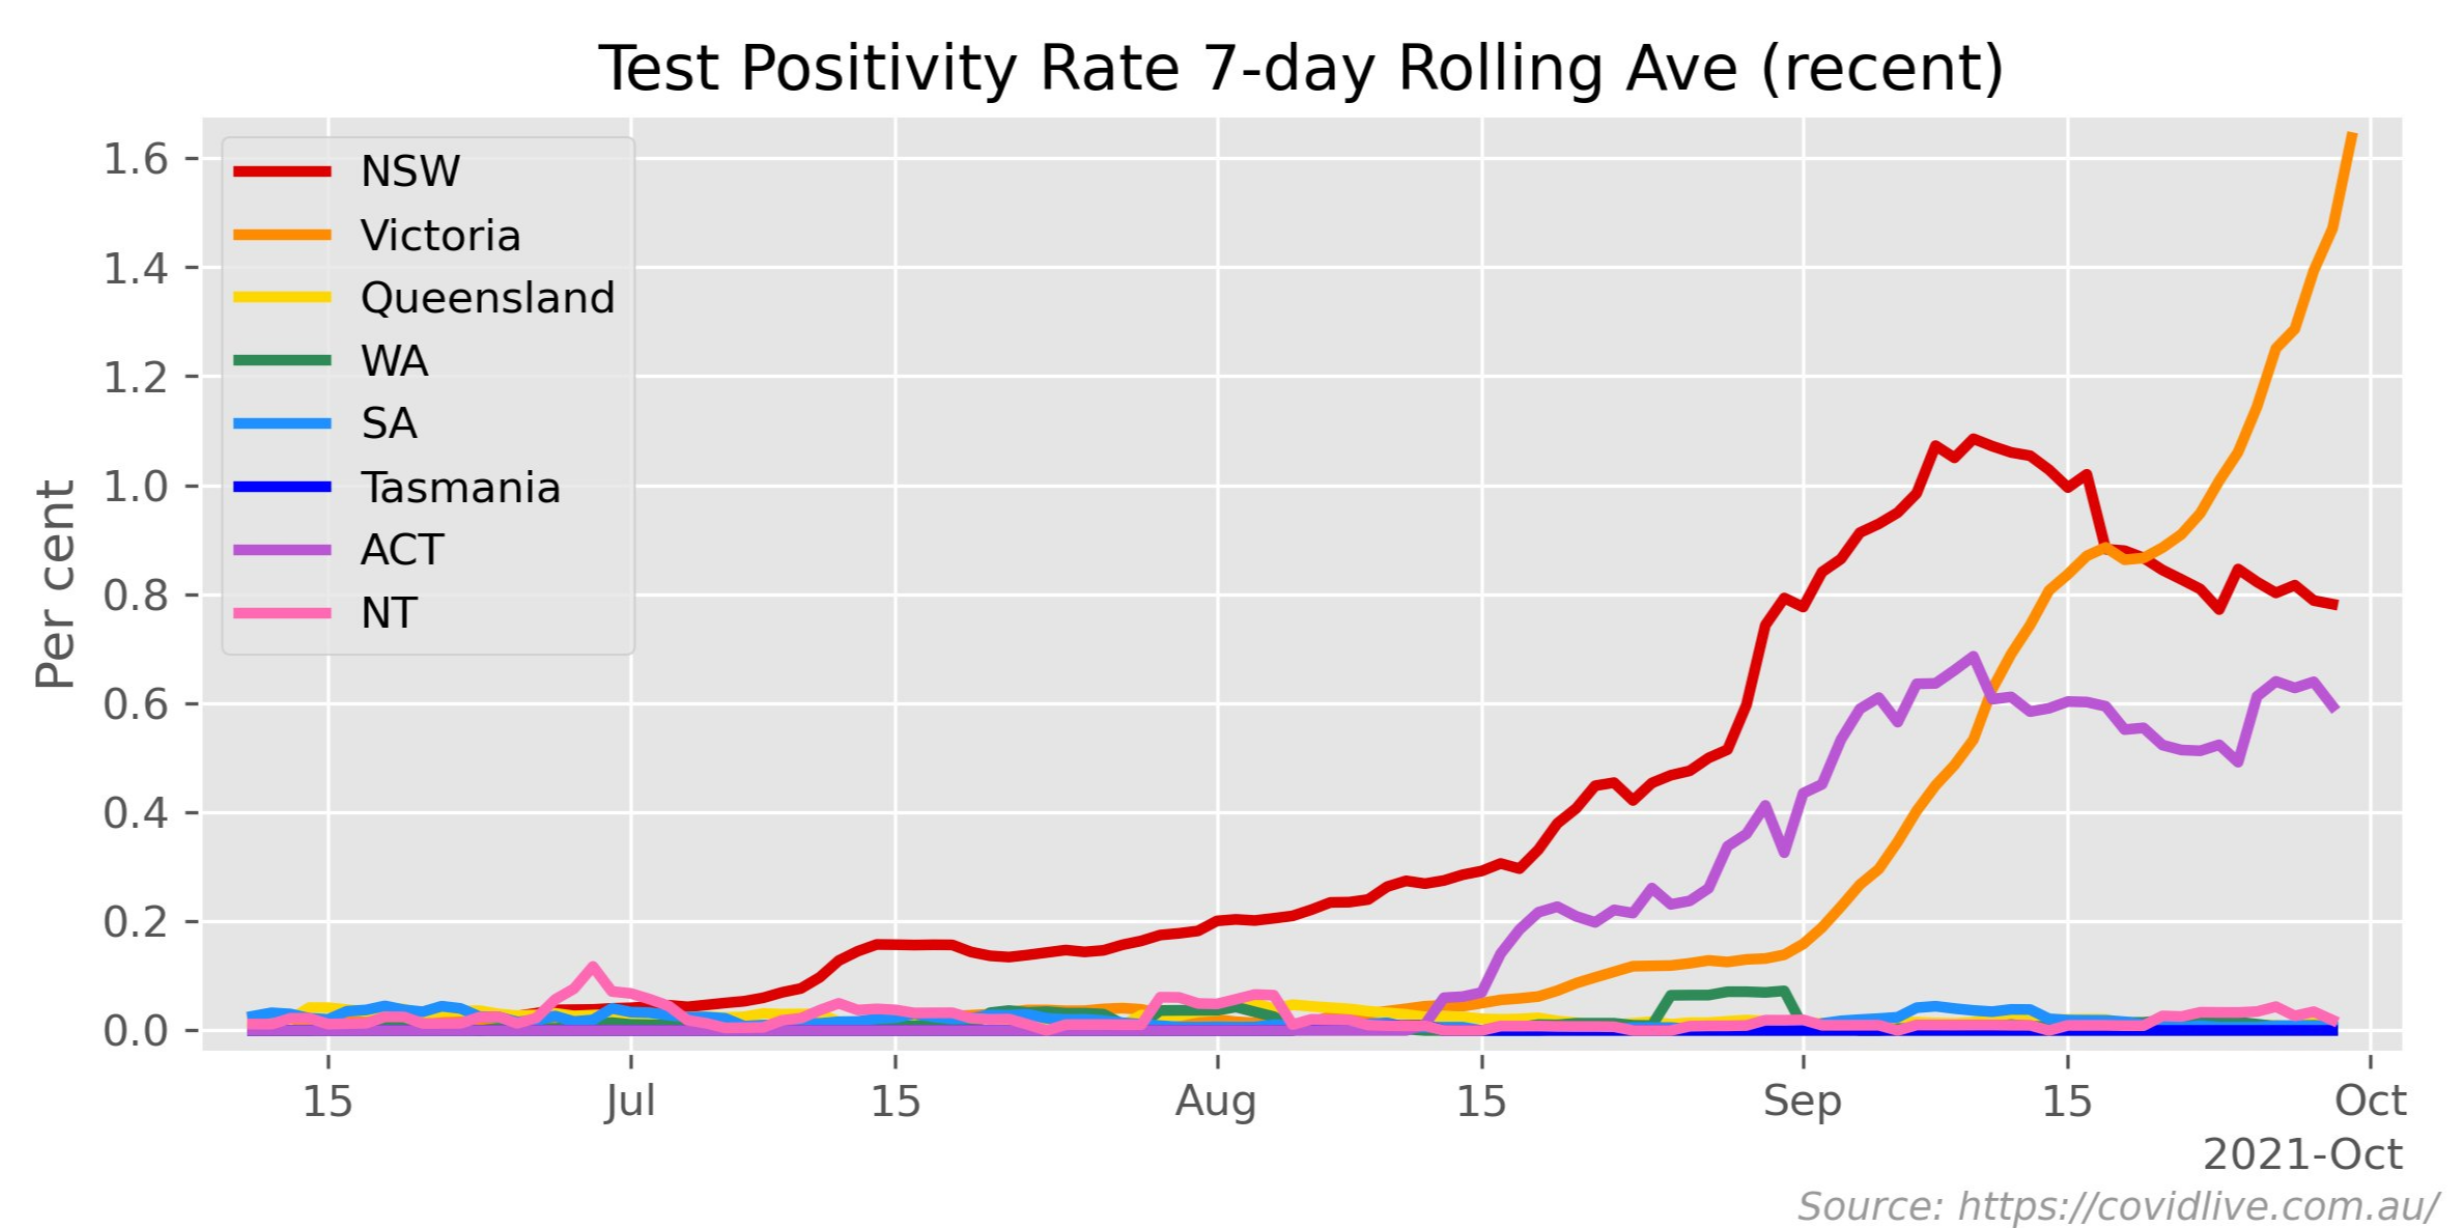
The next chart from Mark The Graph also shows that Victoria’s test positivity rate is also way higher than NSW was at its virus peak:
If you are interested in this type of data, I recommend following COVIDBaseAU on Twitter.
