By Gareth Aird, head of Australian economics at CBA:
Key Points:
- CBA data indicates the increase in government payments via the “COVID‑19 disaster payment” to households in lockdown states has been bigger than the fall in wages and salaries.
- Our partial read of household income, which comprises wages & salaries plus government benefit payments, is growing fastest in NSW whilst it has accelerated very quickly in recent weeks in Victoria.
- There is an extraordinary amount of cash in the system which will facilitate a bounce in services‑related spending and employment on reopening in NSW and Victoria.
- But the speed and level to which activity lifts initially will be heavily impacted by lingering restrictions and health outcomes as well as the time it takes for Australian residents to adapt to ‘living with COVID’.
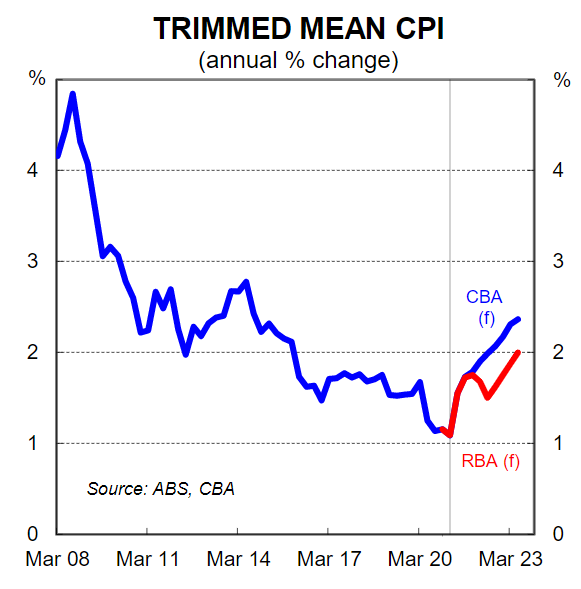
- We expect the significant household income boost over the pandemic because of government payments to contribute to higher consumer inflation in 2022 and forecast underlying inflation to be 2¼% over H2 22.
- Core inflation within target over H2 22 would test the RBA’s resolve on its 2024 conditional forward guidance on the cash rate.
Overview
Analysis from payments into CBA bank accounts indicates that once again a counterintuitive dynamic is unfolding across the country. Our data reveals that growth in household income has accelerated in NSW and Victoria at the same time as Australia’s two biggest state economies contract due to lockdowns which have hit spending and jobs. It is reminiscent of what happened last year nationally when household income stepped up due to fiscal payments as the national economy plunged into recession.
CBA data indicates that at an aggregate level the reduction in household income from job losses to date in NSW and Victoria has been more than offset by an increase in government support payments. Our proprietary indicator of household income that comprises wages and salaries paid plus government benefit payments has accelerated very quickly in NSW and Victoria over the lockdown period. The lift in NSW and Victoria has been enough to see national income spike which means housing savings will continue to balloon. This note looks at our internal income and savings data and the potential implications for inflation and monetary policy.
Wages and salaries paid
Our wages and salaries data captures all wages and salaries paid into CBA bank accounts. In essence it is picking up changes in the level of employment, wages growth, hours worked, compositional shifts in the labour market and any adjustments to marginal tax rates.
Wages and salaries paid into CBA bank accounts had been trending higher in all states across the country until June 2021. But the lockdowns and subsequent negative impact on the labour market have generated a marked divergence between state outcomes (our latest data is to the week ending 10 September).
There has been continued growth in wages and salaries paid into CBA bank accounts in WA (strongest), QLD, SA and Tas. But wages and salaries paid have been moving swiftly lower in NSW and Victoria since late-June due to the lockdowns.
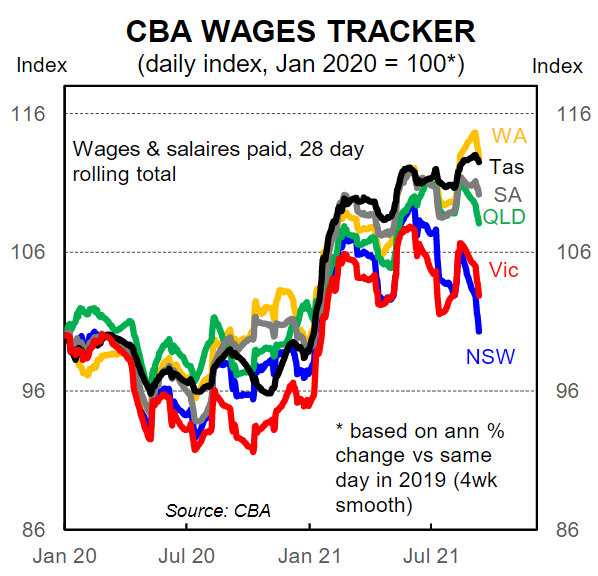
Our data suggests that there has been a contraction in wages and salaries of ~8% in NSW from where Australia’s largest state would have been travelling without the delta-induced lockdown. This is very similar to the fall in ABS payrolls.
Wages and salaries paid in Victoria are down by ~5% over the same period, but Victoria went into lockdown after NSW and had a brief one week reprieve from 28 July to 4 August. We expect wages and salaries paid in Victoria to continue to trend down over coming weeks and anticipate they will land at a contraction of similar magnitude to NSW until reopening.
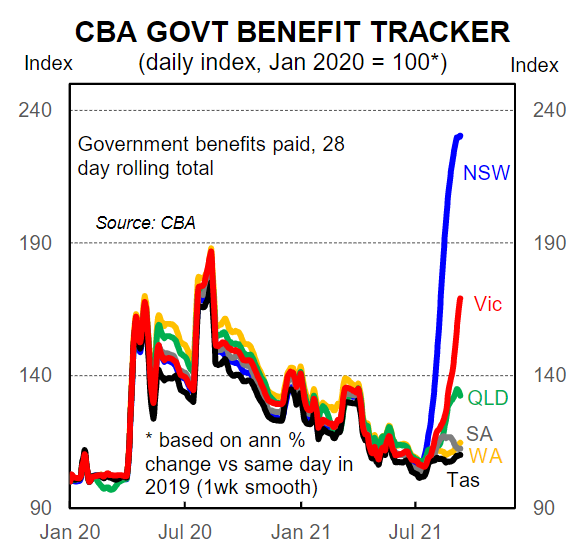
Government benefits paid
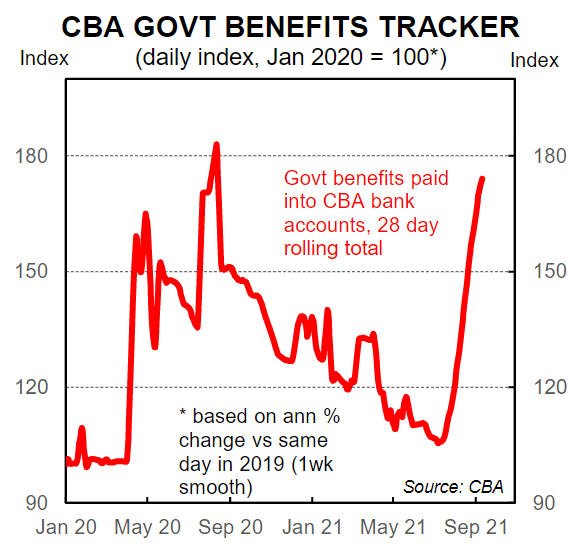
Government benefits paid into CBA bank accounts have surged over the past two months as workers impacted by the lockdowns collect ‘COVID-19 Disaster Payments’. These payments are for those who have lost work or income as a result of a lockdown. The growth in government benefits in NSW and Victoria has been more significant than we anticipated.
To recall, the ‘COVID-19 Disaster Payment’ has three different rates based on the number of hours of work lost by an eligible recipient and whether or not they are receiving an income support payment:
- $A200 per week for those in receipt of an income support payment who lost 8 hours of more of work per week or a full day of their usual hours per week (what the person was scheduled to work including shifts of less than eight hours) as a result of the lockdown;
- $A450 for those who lost 8-20 hours of work per week or a full day of their usual work hours per week as a result of the lockdown; and
- $A750 for those who lost 20 hours or more of work as a result of the lockdown.
There is also the Pandemic Leave Disaster (PLD) payment for those directed to self-isolate or quarantine due to having COVID or being a close contact of someone who does. The PLD payment is $A1500 for each 14-day period a person must self-isolate, quarantine or care for a person with COVID.
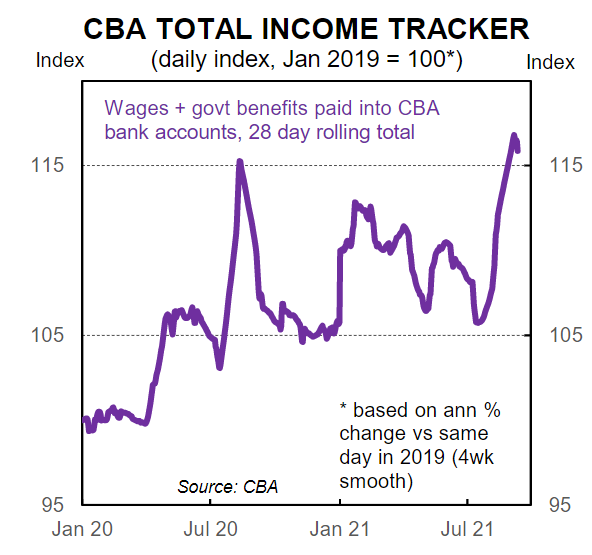
Our partial read on household income
Combining wages and salaries paid into CBA bank accounts with government benefits paid gives us a partial read on household income (it excludes rents, interest earned, dividends and a few other things). Our data indicates that on this measure alone the size of the increase in government payments in NSW and Victoria is significantly bigger than the drop in wages and salaries paid during lockdown. The net result has seen household income surge.
Nationally our household income proxy has stepped up considerably over the past two months. The jump in NSW has been incredible while income has also accelerated very quickly in Victoria. The surge is due to government payments for the states in lockdown. For context, in NSW government payments were worth ~50% of wages and salaries paid over August whereas in May, before the lockdown, they were worth ~25%.
Overall the data indicates that there is a heap of cash that can be deployed to support consumer spending on reopening. Indeed if we were reopening on COVID-zero, spending would likely rebound to its pre-lockdown peak in a matter of weeks.
But the reopening of NSW and Victoria will look very different as we adjust to ‘living with COVID’. A combination of ongoing restrictions, concerns around catching the virus and disruptions caused by mandatory isolation for those either infected with COVID or identified as close contacts will be headwinds on services spending until well into next year. But once we are through that adjustment period household spending will push comfortably above its pre-COVID levels due to the extraordinary amount of cash that has been accrued but is yet to find its way into the economy.
The income, saving and inflation nexus and monetary policy implications
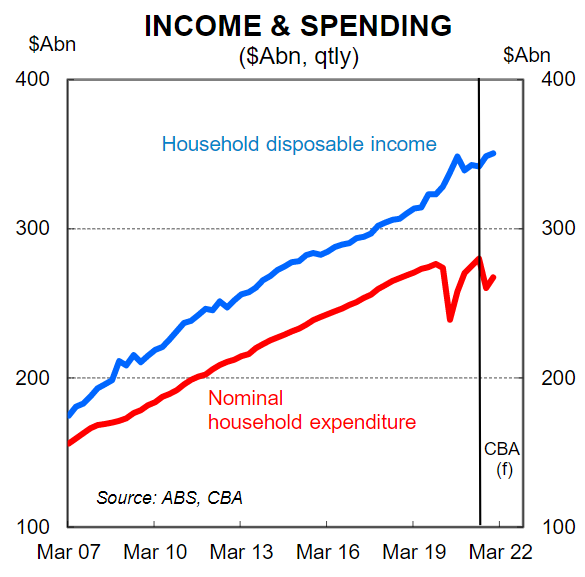
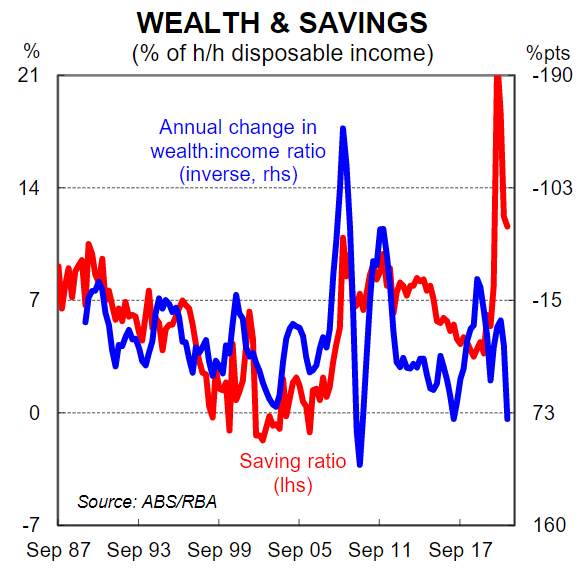
The income boost from fiscal payments coupled with lower spending because of lockdowns has generated an unprecedented accumulation of savings. Our most recent estimate put that figure at $A200bn or 10% of GDP above and beyond what is normally saved over the pandemic period to end-2021. But the income boost we have observed in our data due to the ‘COVID-19 Disaster Payments’ coupled with confirmation a few weeks ago that Victoria will remain in lockdown until it hits a vaccination threshold means that we have upwardly revised that figure. We now estimate that the accumulated savings will total $A230 or 11½% of GDP. This works out to be an average of $A11.2k per person over the age of 16.
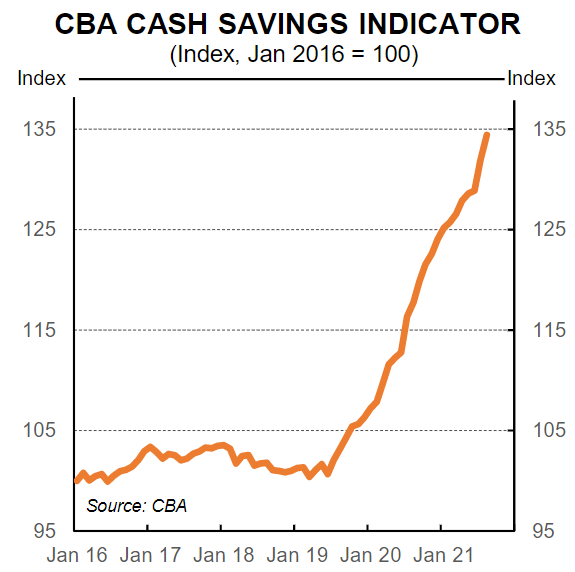
Our internal data paints a very similar picture. The average CBA savings at call per household at August 2021 were up by 22.6% since March 2020 (an increase of ~$A10k per household).
The household income surge, which has generated an almighty war-chest of savings, is an upside risk to consumption and inflation over the next two years. Households did not ‘choose’ to save this money and therefore it is reasonable to assume that we will get a boost in consumption as some households deploy those savings. As this process unfolds we expect to see some demand pull inflation. That is, some businesses will lift the prices of the goods and services they are selling in response to higher demand.
Our expectation for some demand pull inflation means we are not likely to see much in the way of real wages growth over the next two years. Ultimately there will be a price to pay from public debt rising by several hundred billion dollars to support household income through the pandemic and we think that ‘cost’ will show up through a modest lift in consumer inflation.
The RBA is convinced that annual wages growth needs to be “growing by at least 3%” to see inflation sustainably within the target. That logic is correct if you assume the only inflation we may see is ‘cost push’ inflation and that workers receive a productivity dividend. But the massive fiscal expansion coupled with money printing from the RBA via its bond buying program (QE) raises the risk that consumer inflation pulls higher in a way the central bank does not expect and that in turn could raise inflation expectations.
Governor Lowe in his speech of 14 September questioned financial markets for pricing in rate hikes ahead of the RBA’s 2024 mantra on the cash rate. The Governor stated, “the current OIS curve implies a cash rate of around 25 basis points by end of 2022, 60 basis points at the end of 2023 and close to 100 basis points at the end of 2024. These expectations are difficult to reconcile with the picture I just outlined and I find it difficult to understand why rate rises are being priced in next year or early 2023.”
With all due respect to the Governor, financial markets more recently have a better track record in predicting what the RBA will do on the cash rate than the RBA’s own forward guidance and forecasts have implied. And the markets are more acutely aware of upside inflation risk than the RBA.
In July the RBA Governor stated, “I want to make it clear that this focus on wages does not mean we have a target for wages growth or that wages growth necessarily has to have cleared a specific benchmark before we adjust interest rates. The condition for a lift in the cash rate relates to inflation, not wages. It is clear that inflation can increase for reasons unrelated to wages”.
These words slightly contradict the RBA’s repeated assertion that annual wages growth needs to be “growing by at least 3%” to see inflation sustainably within the target. But nonetheless we very much agree with the Governor’s sentiments here.
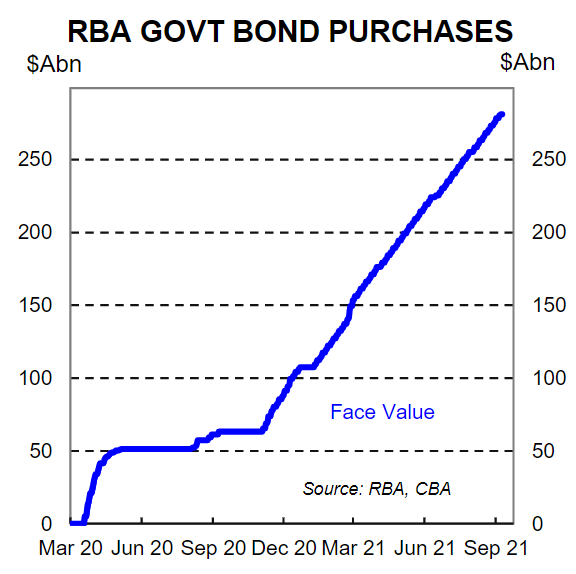
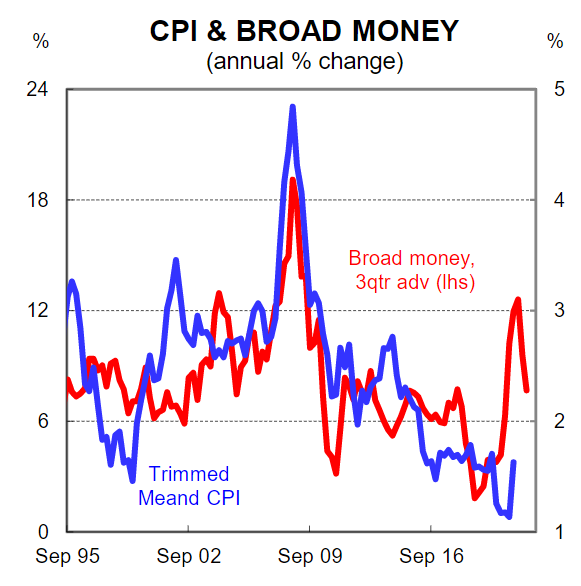
The simple reality is that Australia has been conducting an experiment of sorts in real time over the pandemic. There has been an unprecedented fiscal expansion to support income across the economy which has been indirectly funded by RBA money creation. As a result there have been a massive increase in money supply (i.e. broad money). With fiscal settings set to remain stimulatory over coming years and the Government now playing a much more active role in demand management in the economy compared to pre-COVID we think that inflation will lift earlier than the RBA expects.
We forecast underlying inflation to be 2.2%/yr at end-2022 and 2.4%/yr at mid-2023. In contrast the RBA expects underlying inflation to be 1.75% at end-2022 and 2.0% at mid-2023.
Core inflation within target over H2 22 would test the RBA’s resolve on its 2024 conditional forward guidance on the cash rate. We retain our call for the RBA to commence normalising the cash rate from May 2023 whilst acknowledging the risks are skewed towards a later date for lift off.