Westpac has released its Housing Pulse for August, which examines the impacts of lockdowns on the property market. Westpac believes that recent hard lockdowns across Sydney, Melbourne and elsewhere will impact property turnover rather than prices:
On balance, we expect the situation to see a temporary loss of momentum rather than a correction – even in the most heavily impacted areas – and a rapid snap-back once restrictions ease. ‘Thin’ trading means some sub-markets will be susceptible to weakness near term, particularly where economic pressures are intense and the virus outlook uncertain. However, thin trading also means low ‘on-market’ supply that could be a big issue once activity rebounds, especially given the way demand has already been running well ahead of new listings…
Prices are expected to see a loss of momentum but outright declines look unlikely and growth should reaccelerate quickly once heavily affected markets reopen…
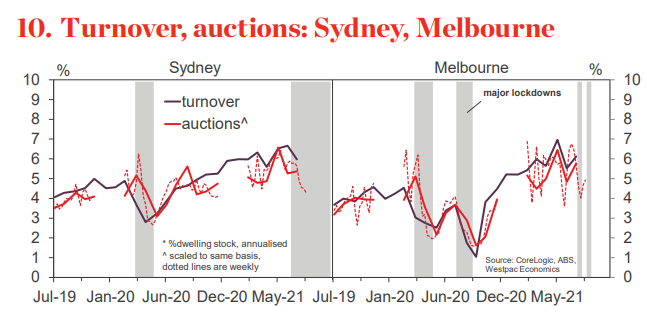
Auction market information is available weekly up to Aug 22 and provides good coverage of the Sydney and Melbourne markets hit hardest by the latest outbreak – the latter also offering a useful point of comparison with last year’s ‘second wave’ lock-down.
Auction volumes are already showing a clear impact. Chart 10 shows these against total monthly turnover (including non-auction transactions) scaled to a consistent base so that auctions can be viewed as a guide to broad activity. The latest weekly data suggests turnover in the Sydney market is down about 30% on its May level, a hefty fall but milder than the 50% slump seen during last year’s national lock-down and the further fall seen during Melbourne’s ‘second wave’ outbreak. Remarkably, turnover is still above the avg levels seen in 2019. Well over 500 properties are still going to auction each week in Sydney. About half are selling prior with about 150-200 proceeding to auction online, the remainder being withdrawn.
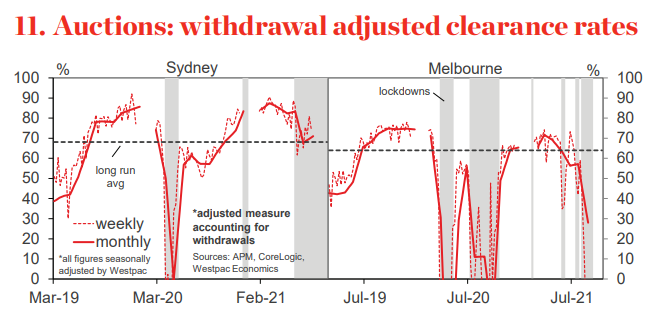
Adjusting for withdrawals provides a useful clearance-based measure of market conditions (Chart 11). These also show a marked cooling in Sydney, but again quite resilient reads overall, close to Sydney’s long run avg. On this basis, the Melbourne market looks to have seen a more material weakening during its recent restrictions.
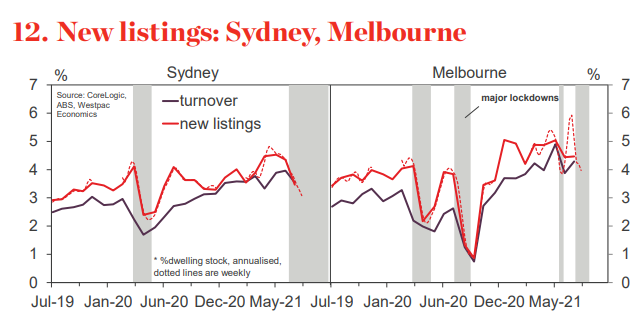
Data on listings is also reasonably timely with figures available weekly (albeit as a 28-day rolling avg). For Sydney, these broadly corroborate the picture from auction volumes, with new listings down 32% from their May level but still comfortably above last year’s lows. Listings have shown a milder decline in Melbourne although the on-again-off -again pattern of lockdowns in recent months has generated big swings.
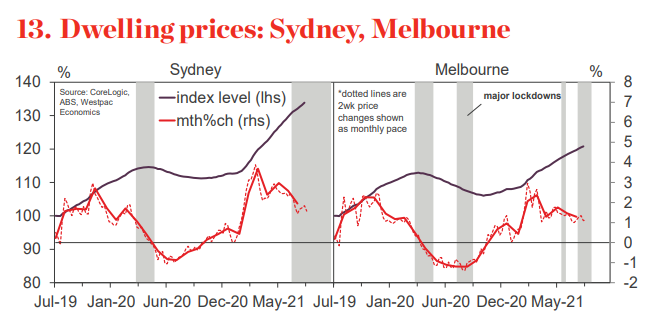
Around prices, CoreLogic’s daily measure points to some moderation in prices gains in Sydney, albeit from a very strong starting point over the first half of the year and still running at a monthly pace in the 1.4-1.8% range – still a strong double-digit annual pace. Evidence of a slowing is even more marginal for Melbourne with daily measures still showing gains running at a 1-1.4% monthly pace.
There is clearly considerably more inertia to prices. Whereas market activity shows big swings during lockdown disruptions, prices look to be less affected. Melbourne’s ‘second wave’ lock-down last year saw a slightly more prolonged period of price weakness compared to other Australian cities but did not prevent the city from entering a price recovery once restrictions eased. Disruptions since then have had even less effect. Much of this likely comes back to sentiment. If disruptions are seen as temporary and medium term prospects are still viewed as positive – as they are now – then prices are much less likely to be affected.
This notion will be tested as the ‘delta’ lock-down drags on, especially as household finances become more stressed. However, with the availability of vaccines providing fundamental support to medium term expectations, we expect prices to remain well anchored.
I share similar views. Previous lockdowns witnessed a fall in both buyer activity and vendor activity before recovering to (or exceeding) pre-lockdown levels once restrictions were eased or lifted. Essentially, the low stock levels supported prices while the various markets were placed on lockdown hiatus.
Leith van Onselen is Chief Economist at the MB Fund and MB Super. He is also a co-founder of MacroBusiness.
Leith has previously worked at the Australian Treasury, Victorian Treasury and Goldman Sachs.