
Friday night saw the risk mood turn buoyant after a tipsy turvy week of oscillating between fear and hope as the BTFD crowd stepped in again to rescue Wall Street. The lack of economic catalysts or further bad news helped pushed defensive assets like the USD down, allowing undollars to catch their breath while Treasury bond yields rose across the curve. In commodity world, the rout in iron ore prices suddenly stopped with a near 8% bounce while oil kept hammering lower, falling 2% to a three month low. Asian shares should start in better condition this trading week.
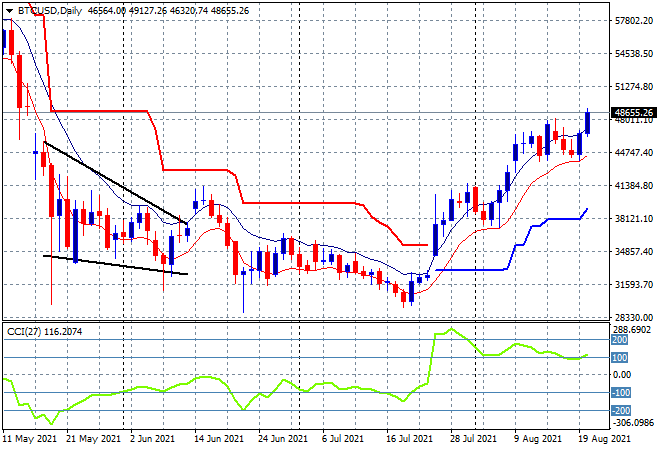
Bitcoin had another solid move higher after consolidating around support at the $44K level and brushing aside resistance overhead at the $48K level for a new monthly high. Daily momentum is still nominally overbought with a solid uncle point at the previous low moving average area on the daily chart at the $43K a good place to engage further longs from here:
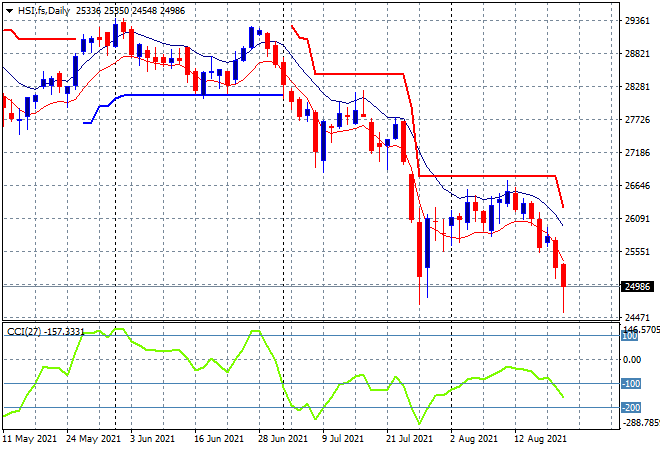
Looking at share markets in Asia from Friday’s session, where the Shanghai Composite slumped nearly 1.2% lower to close the week at 3427 points while the Hang Seng Index had yet another selloff, down 1.8% to close at 24849 points. The daily chart looks quite bearish now after returning to the previous monthly low at 25000 points or so but the long tail of intrasession buying support maybe signalling a very weak bottom picture. However, momentum has not yet gone into extreme mode and this situation looks tenuous and volatile at best:
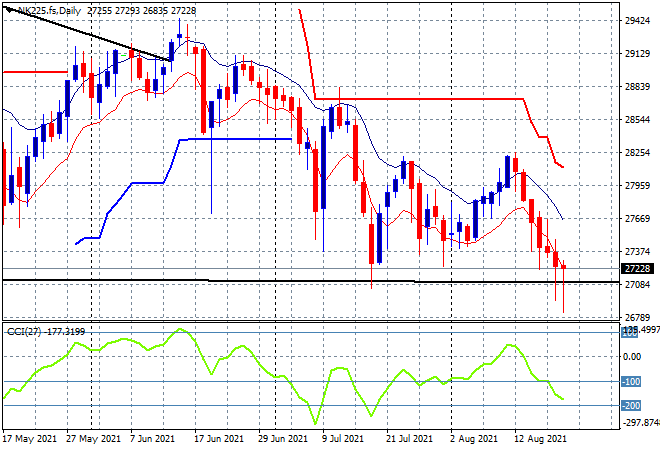
Japanese stocks still fell with no help from the higher USDJPY pair, with the Nikkei 225 finishing 1% lower at 27013 points capping off a fifth red daily candle. This takes it back to the bottom of the previous descending triangle pattern with daily momentum still quite oversold but there has been a lot of intrasession buying indicating by long undertails on these candles. This suggest some weak support building at the 27000 point level but we are close to a complete inversion:
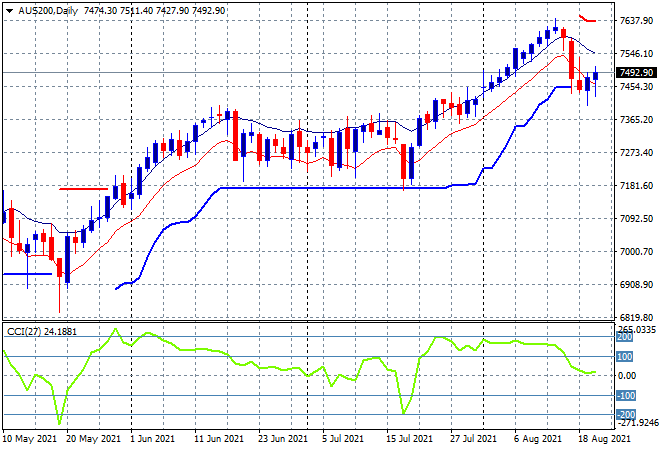
Australian stocks were the relative best performers in the region, with the ASX200 only losing a handful of points to close at a new weekly low at 7460 points. SPI futures are up 30 points or nearly 0.5% so its obvious support is a bit stronger here despite the commodity collapse and continued lockdowns with the lower Aussie dollar helping as well. Watch for the 7400 point level to act as support this week:
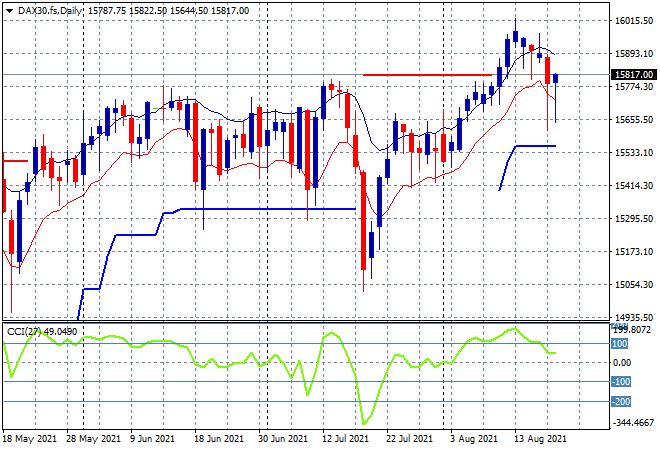
European markets finally had some decent positive sessions to finish the week with the German DAX finishing 0.3% lower at 15808 points. The daily chart is also showing a lot of intrasession volatility with support at the trailing ATR level around 15500 points still quite firm here but watch for a potential move below the low moving average as well as this isn’t over yet:
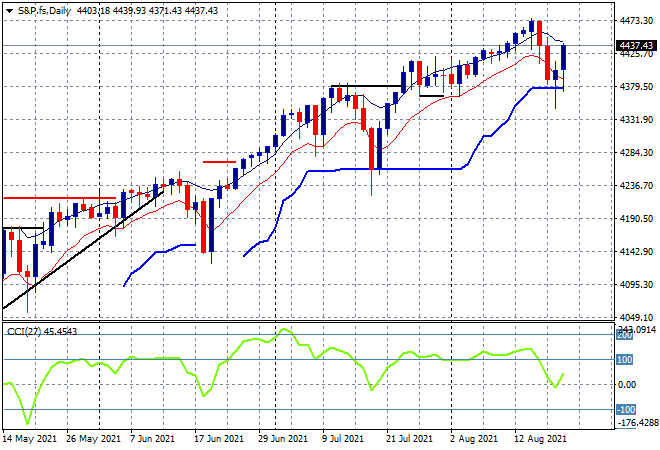
Wall Street of course saw the back filling and paper overing of cracks as all three major bourses had a BTFD rally to finish the week just slightly higher then when they started. The NASDAQ gained nearly 1.2% while the S&P500 put in a 0.8% lift higher to almost get back to its previous historic high. The daily chart shows price bouncing off the 4360 weekly support level (from late July) and then keeping alive above the 4400 psychological level. While price is not yet above the high moving average and momentum is neutral at the daily settings, we are likely to see a rising swing play here to repeat the pattern of dips seen all year:
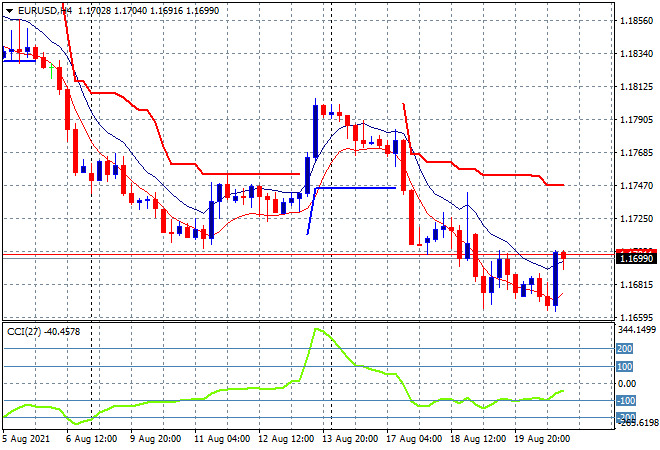
Currency markets remain the most volatile as USD inverted its strong moves on Friday night with Euro bouncing off its weekly low to almost close above the 1.17 handle. Momentum readings are showing a classic swing play here, oscillating from oversold and back into nominally negative so watch for a starting position above the high moving average on the four hourly chart that could have some legs up to trailing ATR resistance at the 1.1750 level:
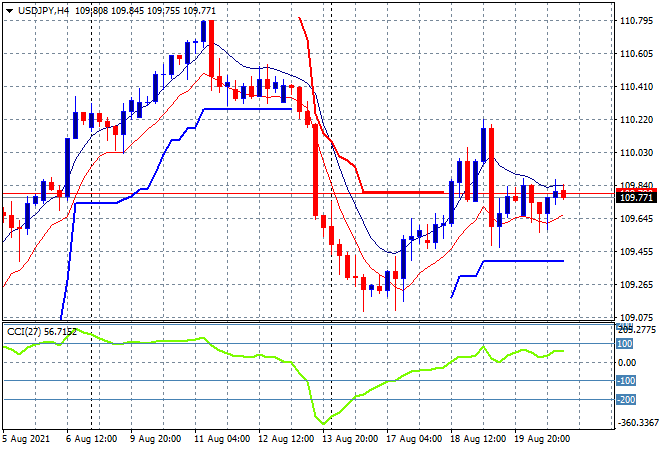
The USDJPY pair was more sanguine on Friday night, cruising into a flat finish just below the 110 handle after a highly volatile previous session as the Yen safe haven buyers and the USD hoarders battle it out. Four hourly momentum remains nominally in the positive zone so look for a push above the high moving average here on the four hourly chart but also position for possible downside as the medium term trend has not yet turned:
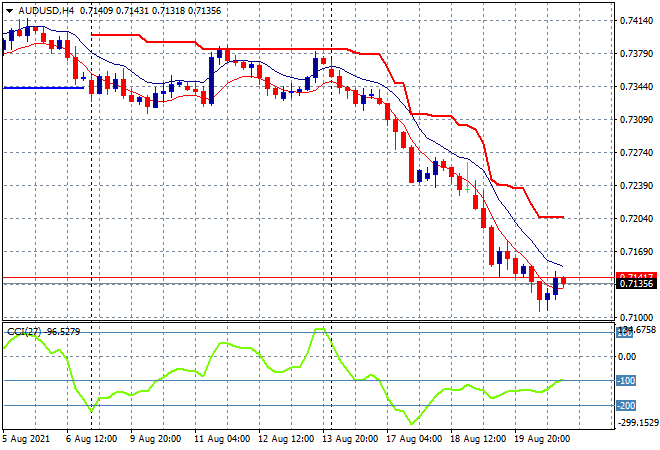
The Australian dollar had a cracker of a week, down over 200 pips and finally paused on Friday night at just above the 71 handle but this still made a new daily/weekly/monthly low. Where this stops as iron ore continues its selloff is very uncertain, and I did mention the 70 handle as the next most likely pause but any bounce in iron ore is likely to be replicated here in the Pacific Peso so watch the low moving average at then trailing ATR resistance proper for signs of a quick swing short covering play:
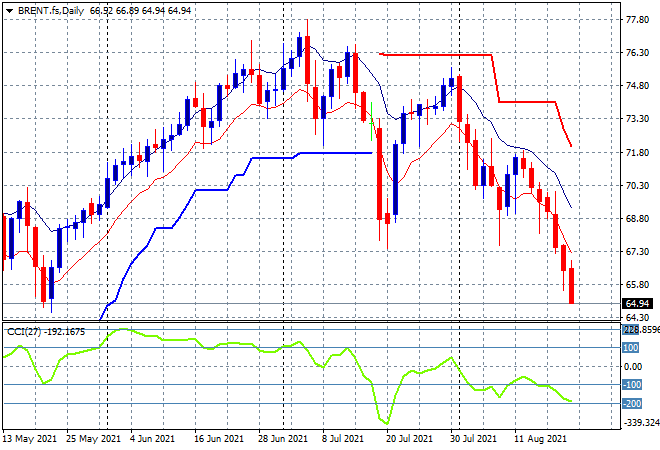
Oil prices were flushed away again after previously cracking through daily support with Brent crude falling 2% to slump below the $65USD per barrel level, taking out all of the previous quarter’s gains. The retest of the previous lows at the $68 level has been played out here for a new monthly low price, with this breakdown putting in play a new move even lower to $60 or so:
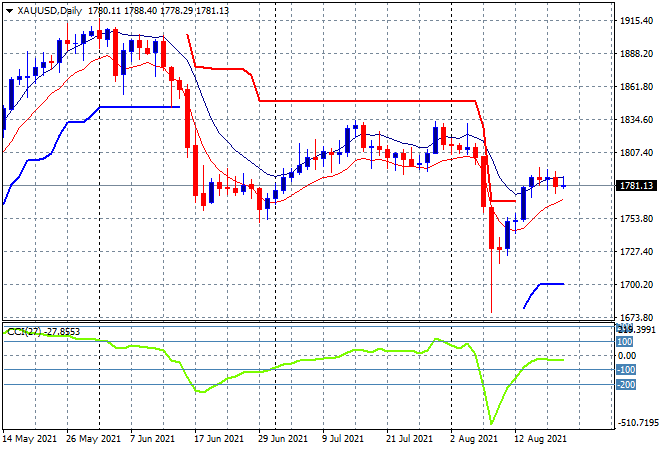
Gold is bravely holding on as the USD gathers strength with another steady session on Friday night keeping the shiny metal hovering around the $1780USD per ounce level but failing again to make a new daily high. While this move has almost recovered the steep losses below the $1800 level, resistance is building here as momentum starts to wane on the four hourly and daily charts, so watch for a potential breakdown soon:
Glossary of Acronyms and Technical Analysis Terms:
ATR: Average True Range – measures the degree of price volatility averaged over a time period
ATR Support/Resistance: a ratcheting mechanism that follows price below/above a trend, that if breached shows above average volatility
CCI: Commodity Channel Index: a momentum reading that calculates current price away from the statistical mean or “typical” price to indicate overbought (far above the mean) or oversold (far below the mean)
Low/High Moving Average: rolling mean of prices in this case, the low and high for the day/hour which creates a band around the actual price movement
FOMC: Federal Open Market Committee, monthly meeting of Federal Reserve regarding monetary policy (setting interest rates)
DOE: US Department of Energy
Uncle Point: or stop loss point, a level at which you’ve clearly been wrong on your position, so cry uncle and get out!