
Risk markets initially followed the poor start to the trading week here in Asia with European bourses taking back their recent gains, as did Wall Street before a mid session fill and then rally saw a new nominal record high for the S&P500 plus a small blip higher for the USD. Commodities remained under pressure however with oil futures continuing to tumble while gold was able to advance slightly despite the resurgent USD.
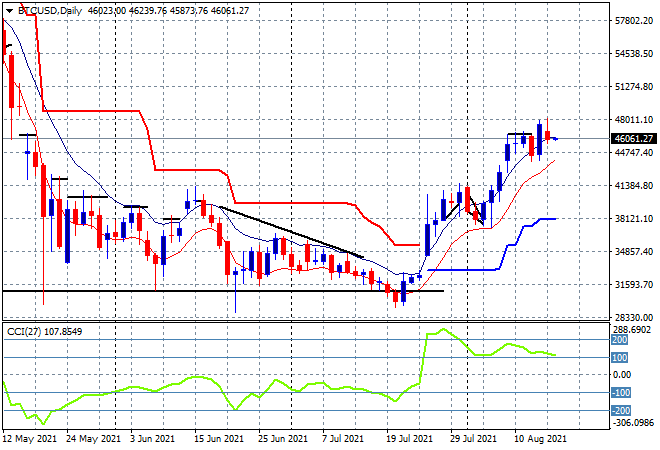
Bitcoin had a slight pause overnight after recently pushing through resistance at the $46K level following its breakout last week, now pulling back from the $48K level to consolidate its gains so far. The daily chart and momentum readings are still suggesting further upside this week but watch support to hold at the $42K level/low moving average area:
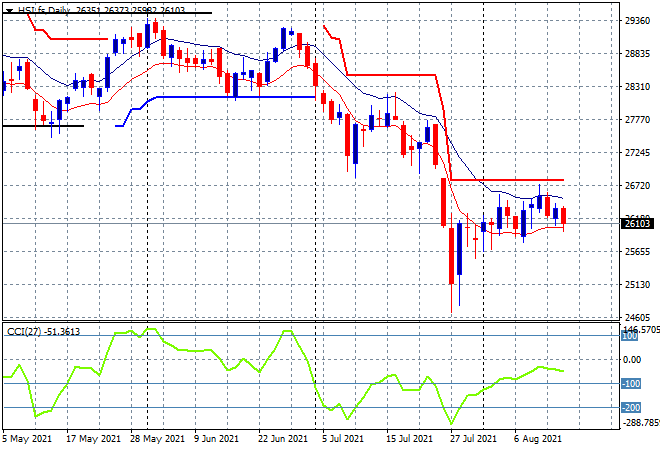
Looking at share markets in Asia from yesterday’s session, where the Shanghai Composite was again unable to gain traction, drifting along to finish flat at 3517 points while the Hang Seng Index was still in reverse gear and down nearly 0.8% at 26181 points. The daily chart is still technically showing a potential bottom pattern but its continuing to struggle to make headway, with a break above the high moving average at the 26700 point level still required to call this rout over. Watch the low moving average here that must not be broken to keep this “bottom” alive:
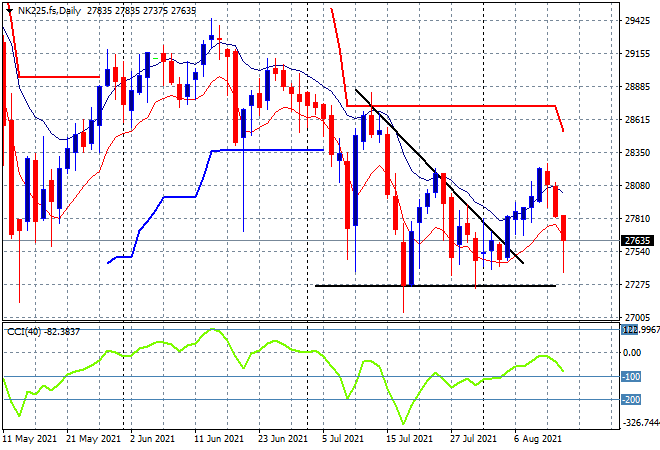
Japanese stocks didn’t like the surprise uplift in GDP figures, held back by a much stronger Yen as the Nikkei 225 slumped more than 1.6% to 27523 points. Price seems to want to return to the bottom of the previous descending triangle pattern with daily momentum rolling over, however yesterday’s candle did have some buying support intrasession, and futures are indicating a possible bounce on the open but support at the 27300 level maybe retested first:
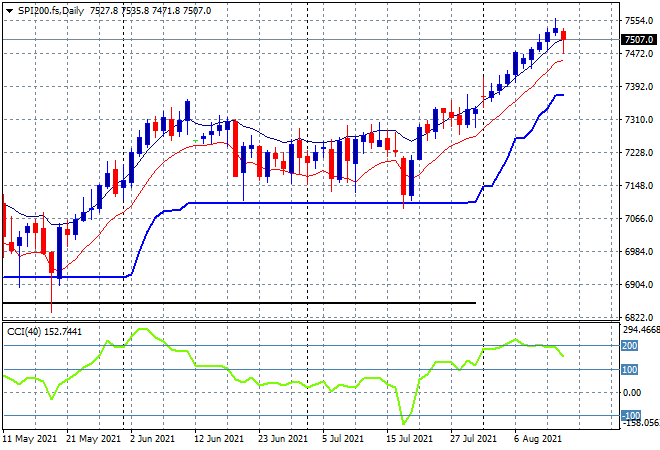
Australian stocks also sold off but not too sharply, with the ASX200 taking back the Friday gains to be down more than 0.6% and back below the 7600 point level. SPI futures are up nearly 10 points, so this surge is likely to continue even as daily momentum readings remain well overbought with the low moving average a clear uncle point to lock in profits/manage risk, but the short term price pattern is possibly setting up a KC Signal (a rare inversion signal with low probability):
European markets all pulled back in unison, with the FTSE falling the most – down nearly 1% – while the German DAX fell back 0.3% to finish at 15925 points. After breaking through key resistance at the previous weekly highs, momentum went into extreme overbought mode so I had expected this sharp retracement particularly as Euro reversed course and went higher. However, it could be short lived and just what this rally needs to catch its breath so watch for the low moving average to remain supported:

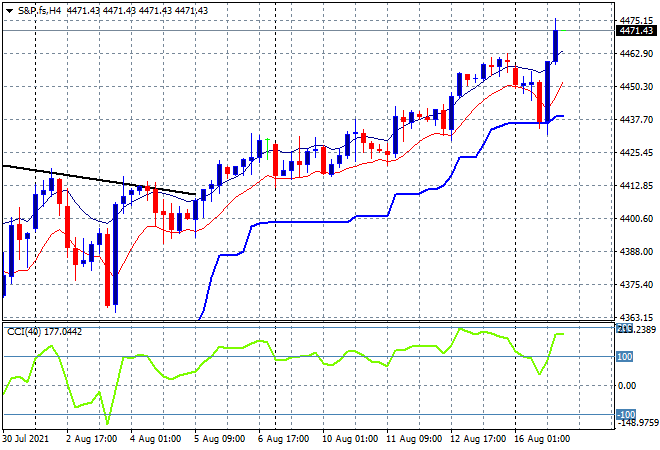
Wall Street was all over the place, down considerably at first before filling in towards the end of the session, although the NASDAQ finished slightly in the red, the headline Dow and the S&P500 pushed nearly 0.3% higher, the latter to yet another nominal record high to close at 4479 points. The four hourly chart shows this snapback very clearly with price going down to trailing ATR support before the BTFD crowd stepped in and whisked it away to yet another high. Momentum looks overcooked again but you can’t stop this music!
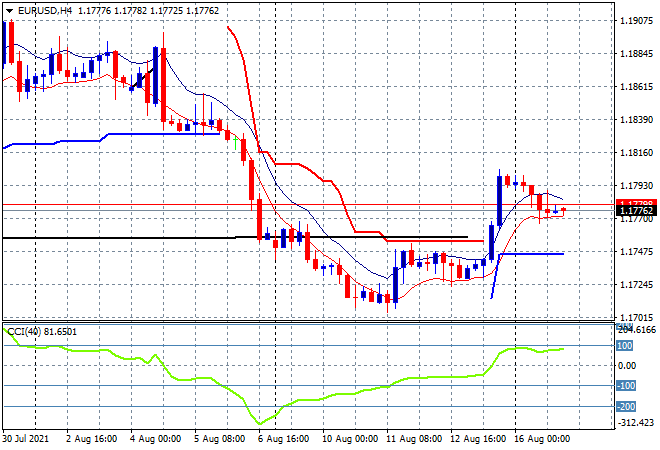
Currency markets remain somewhat volatile with some minor reversals to the Friday night action in play across some of the undollars, so it hasn’t been as co-ordinated as expected, particularly the Aussie dollar. The Euro lost a little ground from its Friday surge, reverting back to the 1.1770 level here to consolidate and build higher but as I said last week it remains to be seen if this is sustainable so watch for the previous support now resistance level at 1.1820 as a short term sign of more Euro strength:
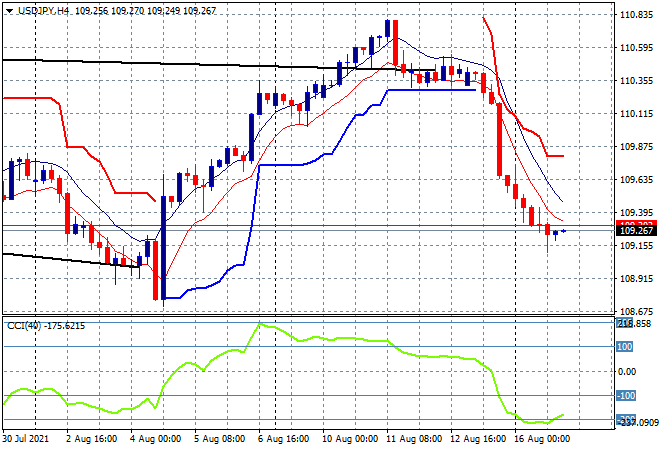
The USDJPY pair continued to deflate but is possibly finding some support at just above the 109 handle overnight as short term momentum looks extremely overstretched. Yen safe haven buying alongside bonds has not yet abated so this risk proxy continues to suffer but we could see a small snapback rally – or – another leg down given the geopolitical volatility at the moment:
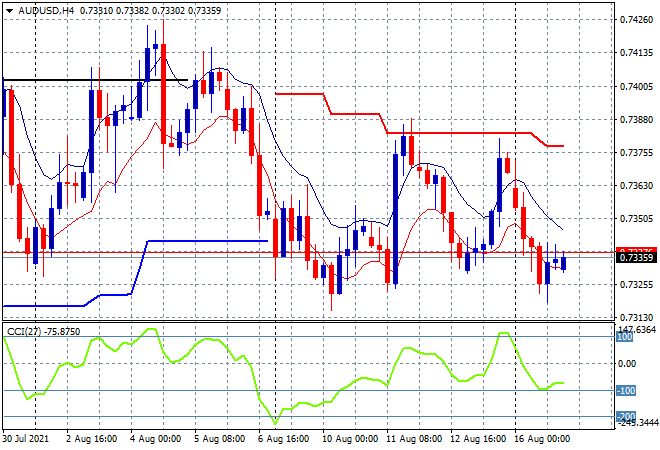
The Australian dollar is still showing some interesting patterns and divergence with more selling pressure to start the week indicating that the overall market is still well bearish on the Pacific Peso. As I said previously, this still looks like a time to add to long term short positions/hedges while in the short term there is the possibility of a breakdown below the 73 handle if commodity prices (notably iron ore) remain under pressure:
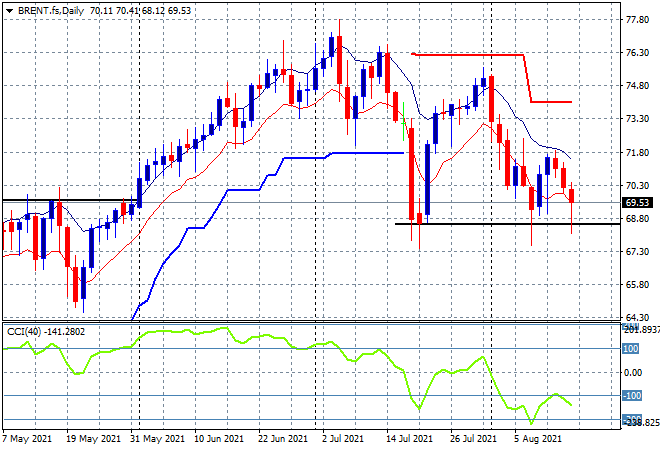
Oil prices are looking very tenuous here with another drop to start the week with both WTI and Brent crude down more than 1%, the latter starting the week by breaking below the key $70USD per barrel level. The retest of the previous lows at the $68 level remains in play here as the bullish double bottom pattern has all but evaporated on the daily chart, with price unable to close above its own daily high moving average. Watch for a break below the low moving average line next:
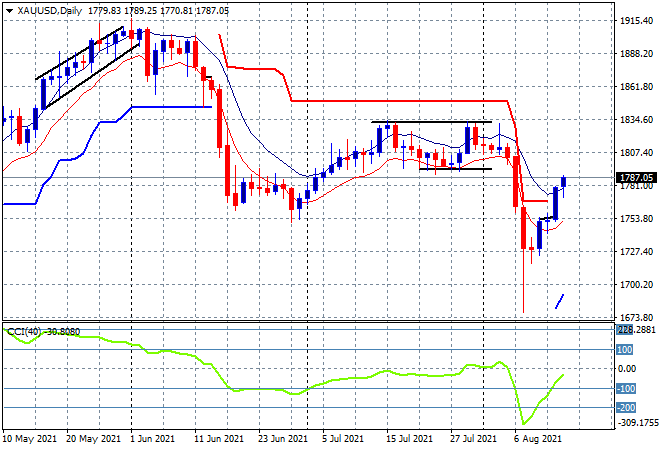
Gold is still fighting back however with a strong session overnight pushing the shiny metal well above the $1780USD per ounce level. This move is recovering a lot of the steep losses below the $1800 level with that resistance level the key area to blast through this trading week with daily momentum not yet calling this a new rally:
Glossary of Acronyms and Technical Analysis Terms:
ATR: Average True Range – measures the degree of price volatility averaged over a time period
ATR Support/Resistance: a ratcheting mechanism that follows price below/above a trend, that if breached shows above average volatility
CCI: Commodity Channel Index: a momentum reading that calculates current price away from the statistical mean or “typical” price to indicate overbought (far above the mean) or oversold (far below the mean)
Low/High Moving Average: rolling mean of prices in this case, the low and high for the day/hour which creates a band around the actual price movement
FOMC: Federal Open Market Committee, monthly meeting of Federal Reserve regarding monetary policy (setting interest rates)
DOE: US Department of Energy
Uncle Point: or stop loss point, a level at which you’ve clearly been wrong on your position, so cry uncle and get out!