
Friday night saw the release of the latest US consumer confidence survey which unexpectedly dropped to a near decade low, most likely due to the unvacinnated chaos spreading across the Trump States as the delta COVID variant creates an epic third wave. This saw a big drop in USD and Treasury bond yields following an earlier reversal that has had bond and currency markets reach new heights of volatility. While Wall Street eked out yet another record high, it was only just a handful of points as risk markets are pointing to a possible pullback as we start a new trading week amid some further geopolitical heat from Afghanistan. Watch oil which had a minor 1% loss on Friday night, while other commodities are also looking very shakey.
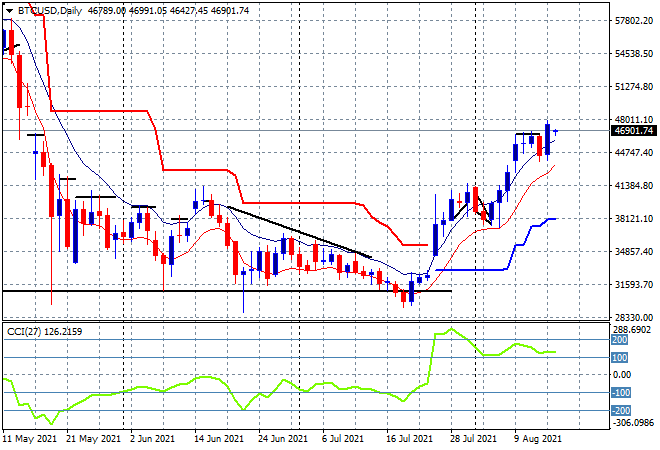
Bitcoin however had a great run, after coming up against resistance at the $46K level following its breakout last week, it was able to climb above $48K temporarily and looks set for further upside this week as the daily chart recovers from the sub $30K bottom it reached in July:
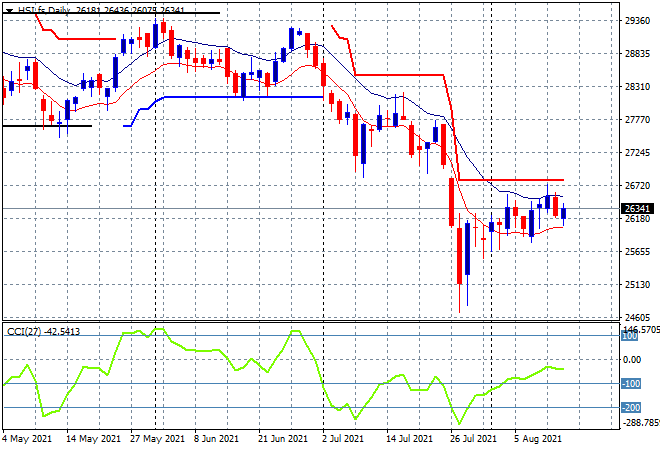
Looking at share markets in Asia from Friday’s session, where the Shanghai Composite was unable to gain traction, drifting 0.2% lower to 3515 points while the Hang Seng Index was back in reverse gear closing 0.5% lower at 26391 points. The daily chart is still technically showing a potential bottom pattern but its continuing to struggle to make headway, with a break above the high moving average at the 26700 point level still required to call this rout over:
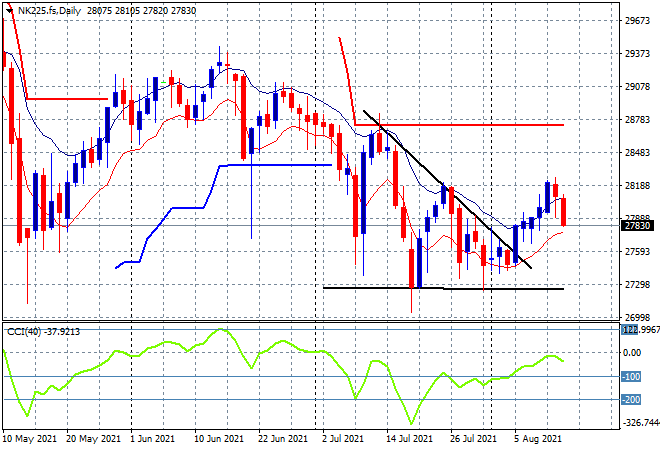
Japanese stocks put in a scratch session with the Nikkei 225 closing down a handful of points to finish the week just below the 28000 point level. This breakout was already losing steam before it even starts as price remains above the descending triangle pattern setup, but daily momentum never got to positive readings so with a rise in Yen we could see some more downside positioning here this week with a potential return to the 27300 support level:
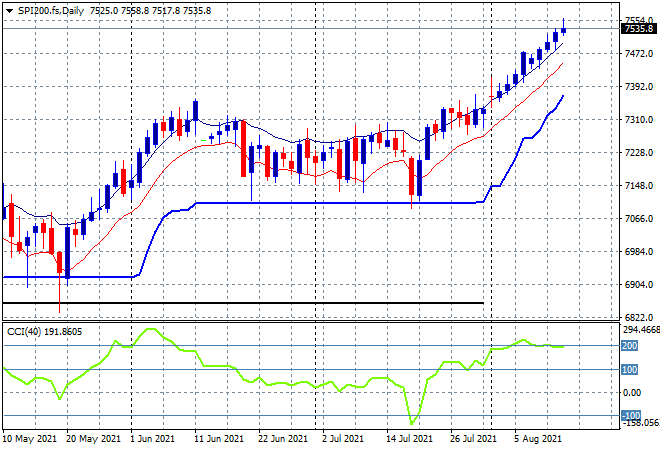
Australian stocks however stood out with a very solid session to finish the week with the ASX200 up more than 0.5% to cross the 7600 point level, closing at 7628 points. SPI futures are showing a very small pullback to start the new trading week, but this surge is likely to continue even as daily momentum readings remain well overbought as the daily chart looks very good in the medium term, with the low moving average a clear uncle point to lock in profits/manage risk:
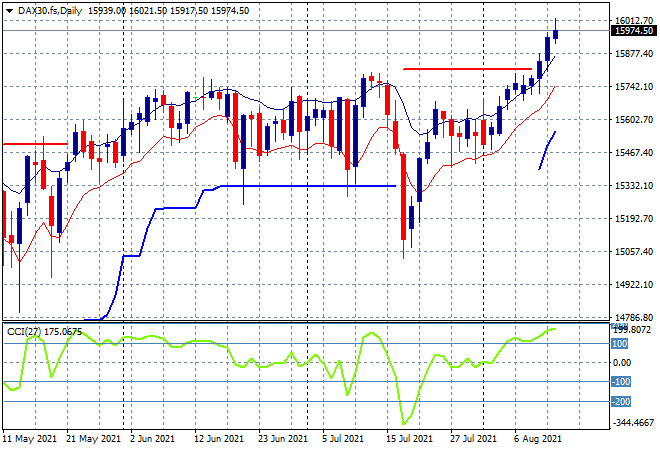
European markets had firm moves higher across the continent to finish their own trading week, despite a higher Euro with the German DAX lifting 0.25% to finish at 15977 points. After breaking through key resistance at the previous weekly highs, there has been a FOMO rally here with momentum in extreme overbought mode which is setting up for a sharp retracement particularly as Euro advances higher. Watch for a new daily low as price action looks stretched here in the very short term:
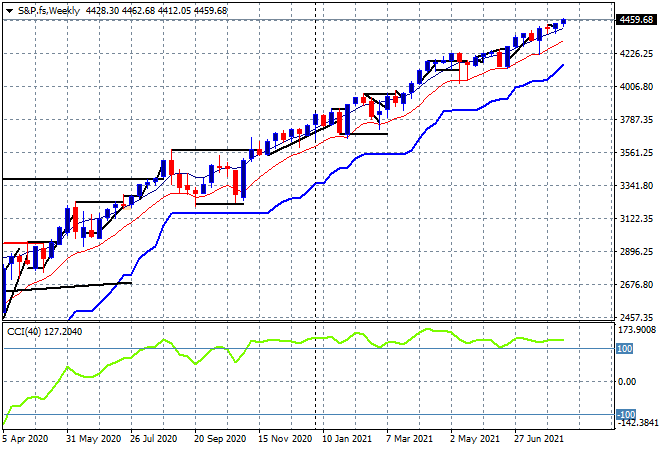
Wall Street was less bullish, with three scratch sessions across the major bourses – and only just in the case of the NASDAQ – while the S&P500 put in yet another nominal record high, it was only handful of points – 0.1% higher to close at 4468 points. Switching to a weekly chart and its all butter and roses with momentum remaining nicely overbought and support continuing to build all throughout 2021 – no danger at all with is epic rally!
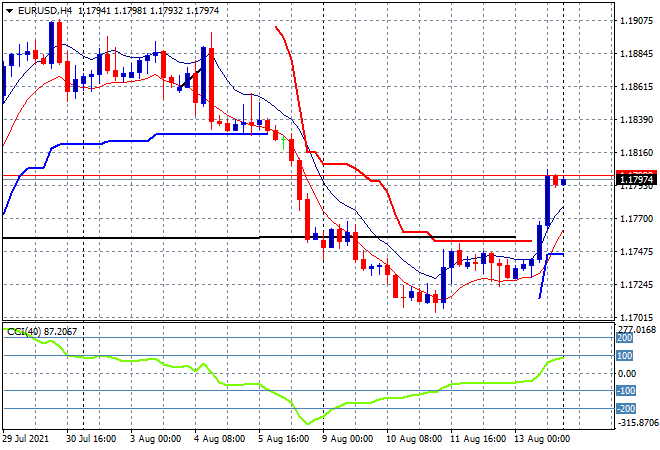
Currency markets returned to high volatility settings on the consumer sentiment survey with Euro breaking out of its glum mood, bouncing off the 1.17 handle and almost finishing above the 1.178 level on Friday night. It was looking like rolling over and getting back to its recent four monthly low as the short term mean reversion swing evaporated, but one print and whoosh we are back to USD selling off. It remains to be seen if this is sustainable so watch for the previous support now resistance level at 1.1820 as a short term sign of more Euro strength:
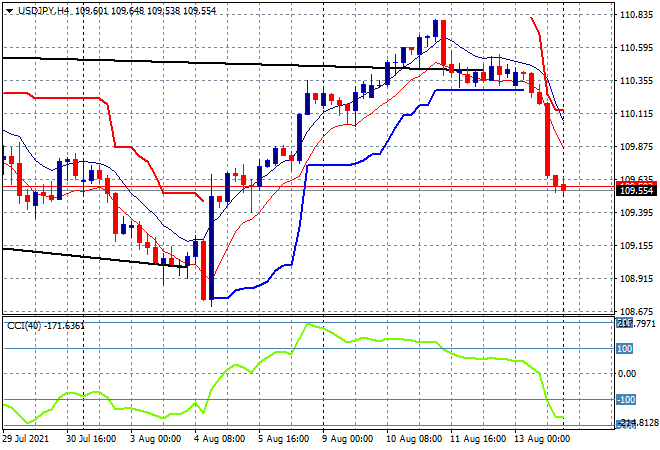
The USDJPY pair was flummoxed of course with Yen safe haven buying alongside bonds sending the pair down to the previous weekly low at the mid 109 level. This keeps the medium term trend intact, i.e down with price action remaining below the weekly downtrend line (upper sloping black line). Four hourly momentum has reverted back into oversold negative mode so we are likely to see more downside here as we start the new trading week:
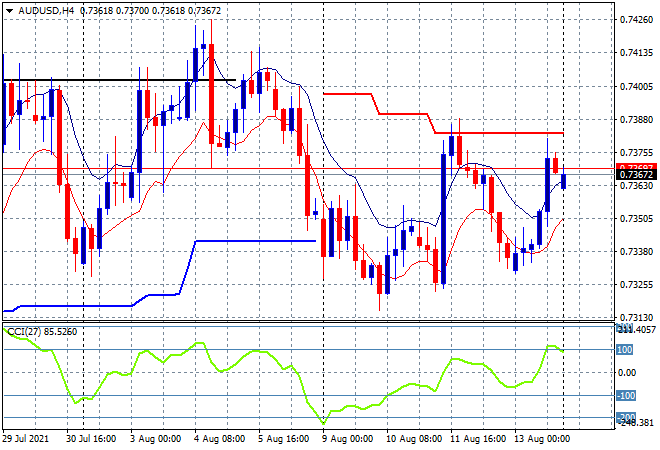
The Australian dollar is still showing some interesting patterns and divergence here because everytime USD goes south it doensn’t automatically respond at the same relative terms, indicating that the overall market is still well bearish on the Pacific Peso. Indeed I would be adding to long term short positions here everytime there’s a minor sniff of a rally and this looks like another add-on setup:
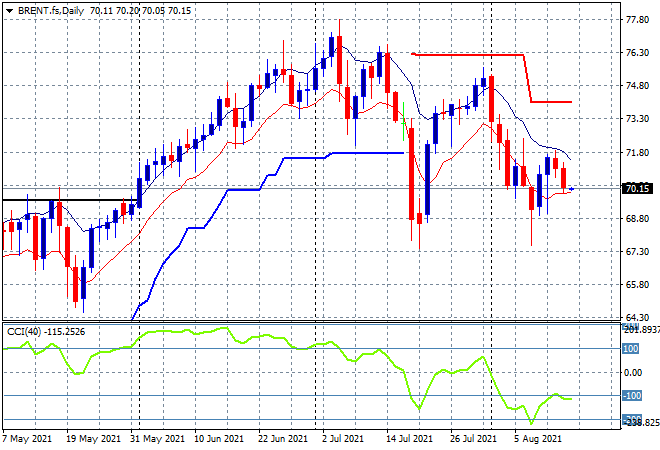
Oil prices were unable to continue a refill play with a 1% drop again on Friday in both WTI and Brent crude the latter finishing the week just above the key $70USD per barrel level. The retest of the previous lows at the $68 level remains in play here as the bullish double bottom pattern has all but evaporated on the daily chart, with price unable to close above its own daily high moving average. Watch for a break below the low moving average line next:
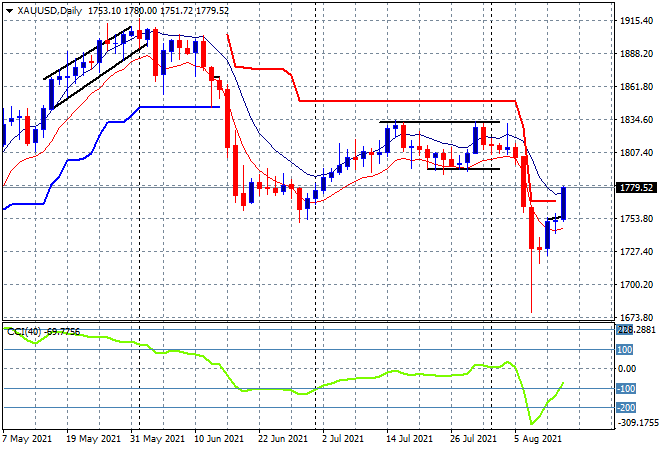
Gold’s deflation has been filled by a weaker USD with a rousing session on Friday, pushing the shiny metal well above the $1770USD per ounce level. This move is recovering a lot of the steep losses below the $1800 level with that resistance level the key area to blast through this trading week with daily momentum not yet calling this a new rally:
Glossary of Acronyms and Technical Analysis Terms:
ATR: Average True Range – measures the degree of price volatility averaged over a time period
ATR Support/Resistance: a ratcheting mechanism that follows price below/above a trend, that if breached shows above average volatility
CCI: Commodity Channel Index: a momentum reading that calculates current price away from the statistical mean or “typical” price to indicate overbought (far above the mean) or oversold (far below the mean)
Low/High Moving Average: rolling mean of prices in this case, the low and high for the day/hour which creates a band around the actual price movement
FOMC: Federal Open Market Committee, monthly meeting of Federal Reserve regarding monetary policy (setting interest rates)
DOE: US Department of Energy
Uncle Point: or stop loss point, a level at which you’ve clearly been wrong on your position, so cry uncle and get out!