
Equities bounced back on Wall Street as corporate earnings overshadowed everything else, although stronger US factory orders and more Fed talk supporting a gradual taper helped as well. Treasury yields however spell out the better picture and remain down at multi month lows while currency markets saw a big of USD strength eke back in. Commodities were again mixed to the downside, with oil slipping further after its poor start to the week while gold once more hovered just above the $1800USD per ounce level.
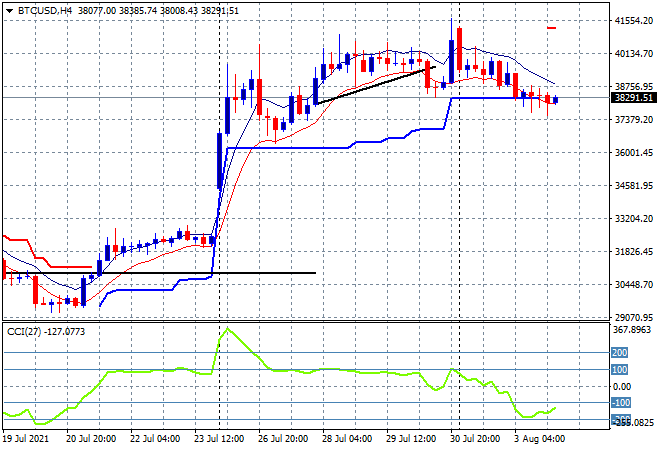
Bitcoin is slipping again, falling through the $39K level overnight after a lack of buying action has seen its false breakout on Friday night dwindle back to the previous week lows. The four hourly chart still shows a series of lower lows since the Monday morning gap with price now pushing through nominal trailing ATR support so expect possible volatility ahead at these key levels:
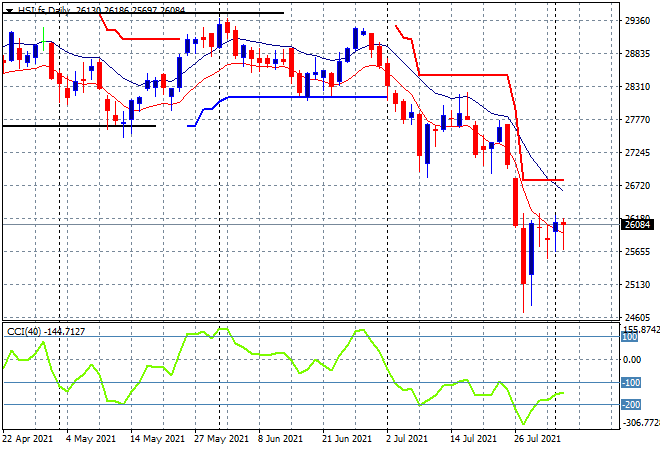
Looking at share markets in Asia from yesterday’s session, where the Shanghai Composite put on the brakes, down 0.5% to close at 3447 points while the Hang Seng Index was looking to fall the same but came back at the close to only finish down 0.2% at 26194 points. The daily chart remains poised here as a potential bottom continues to form with a series of higher lows not yet confirmed by a substantial breakout above the 26700 point level:
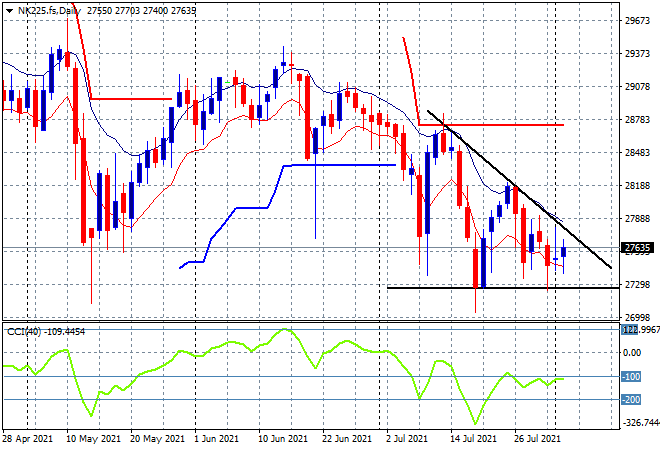
Meanwhile Japanese stocks followed the same path, with the Nikkei 225 closing 0.5% lower at 27641 points. Futures are a little bit more upbeat however with the descending triangle pattern on the daily chart confirming the bearish mood but also setting up any breakout – or breakdown – points to be wary off in the next few sessions:
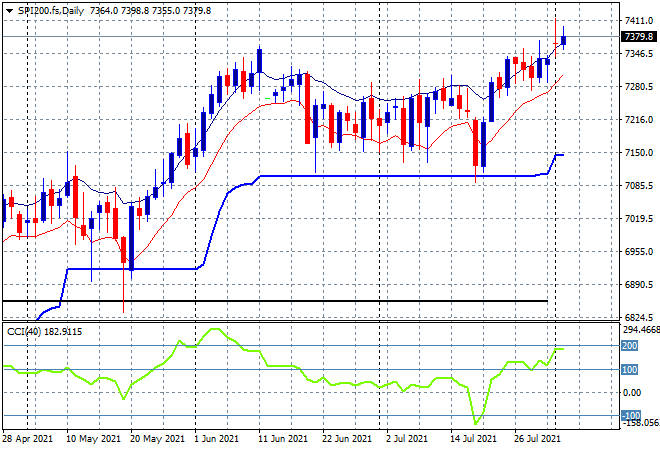
Australian stocks were the best performers, having looked through the do-nothing RBA meeting with the ASX200 only retreating some 0.2% to still remain well above the 7400 points level, closing at 7474 points. SPI futures are up around 10 points so we should see a return to the still quite bullish mood as daily momentum remains nicely overbought and the daily chart still looks bullish here in the medium term:
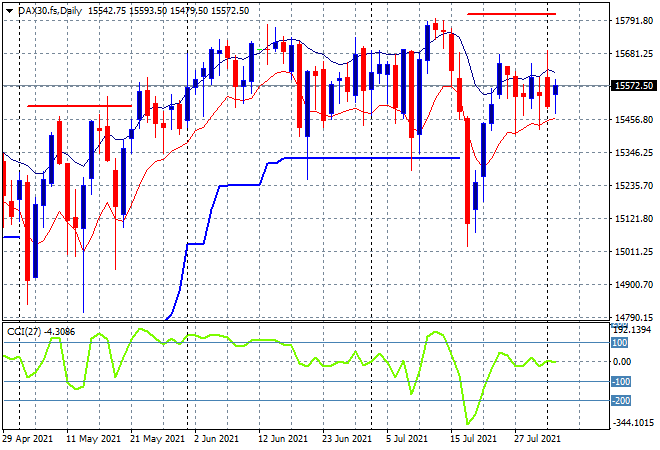
European markets again saw a divergence between the peripheral and center bourses with the German DAX actually falling back as the rest of the continent moved forward, even as the German Mark, I mean Euro fell back slightly, finishing 0.1% lower at 15555 points. While price action remains above previous daily ATR support at the 15300 point level momentum is still at a neutral/negative setting as price action remains listless:
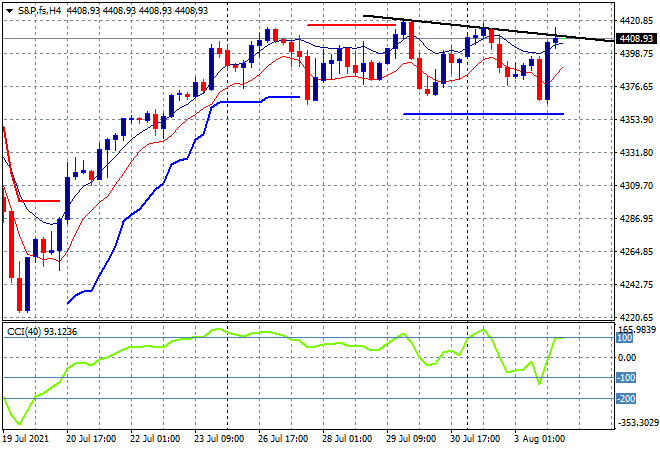
Wall Street played catchup with the solid earnings reports with all three markets lifting higher, the NASDAQ up 0.5% while the S&P500 surged nearly 0.9% higher to finish back above the 4400 point level at 4423 points. The four hourly chart has formed a solid rectangle pattern that has continued from last week with a tight band of support and resistance at the 4360 and 4420 point levels respectively. The lack of a decent session high since late last week maybe suggesting a medium term rounding top pattern forming but don’t fight the Fed here:
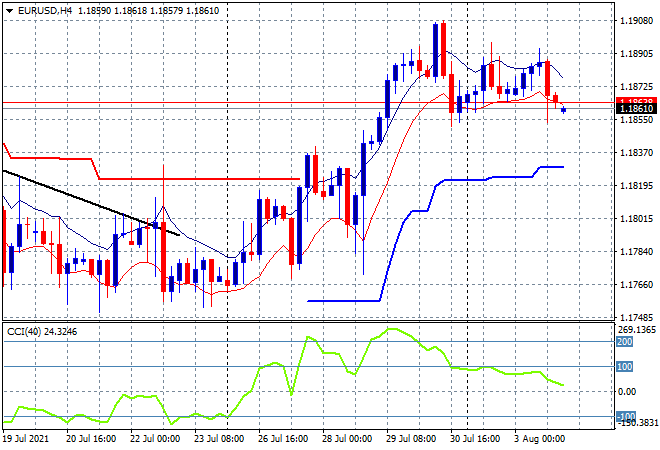
Currency markets were relatively calm again with USD continuing its mixed run against the majors, with a little strength coming back overnight. Euro fell back to its start of week run at the 1.1860 level with the four hourly chart still showing momentum in its reversion phase from previously overbought but as I asked yesterday can price be supported here if Treasury yields continue to fall:
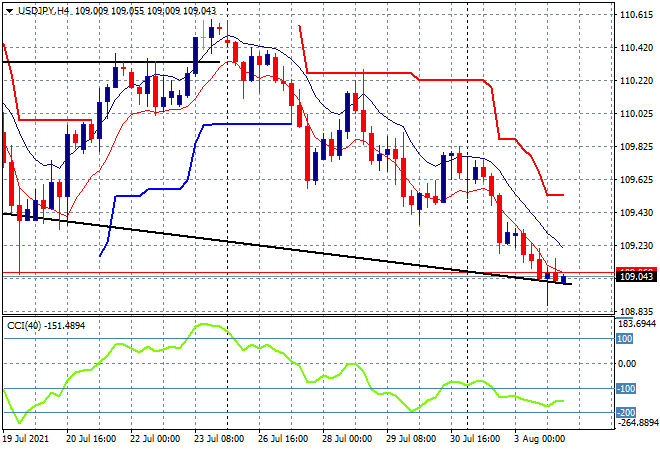
The USDJPY pair remains in a decline, albeit decelerating as it continues to head back towards the 109 handle and further below the previous weekly lows. The four hourly chart continues to look like the bearish Nikkei 225 and while my target at the 109 handle has almost been reached I’m wary of the short term deceleration offsetting the nominally oversold momentum readings which could be presaging a volatile swing higher:
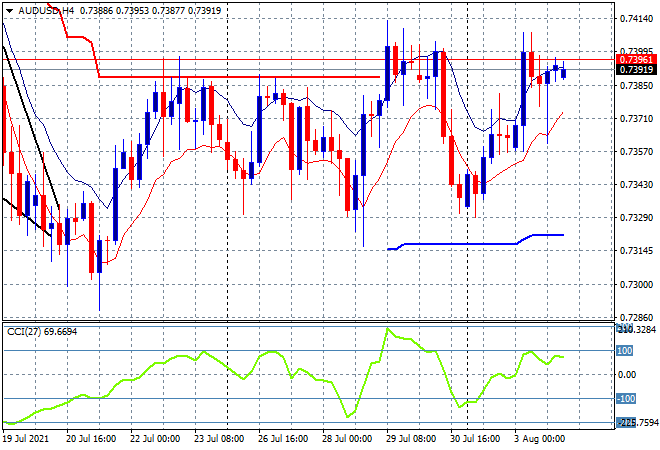
The Australian dollar was nominally supported but still unable to clear its stuck mood here again despite the weaker USD as it tried to pop above the 74 handle overnight. The medium term price pattern is essentially bearish but in the short term its really wanting to get through that 74 cent resistance level but its tough going here. Note how momentum has been positive but not yet overbought despite the RBA meeting yesterday which didn’t give it the catalyst it needs:
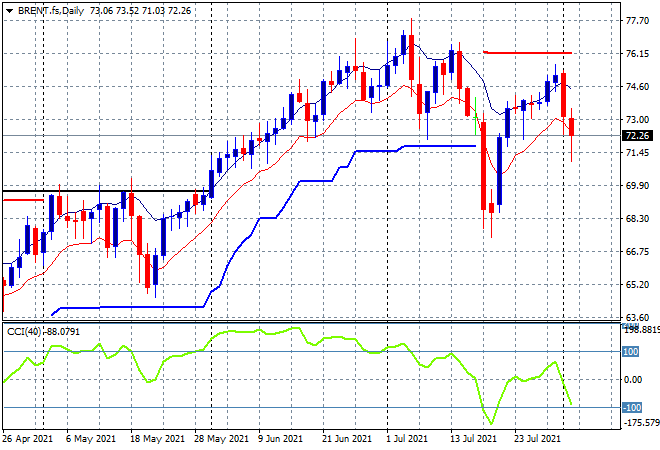
Oil prices are poised here following the slump after the recent ISM survey with Brent crude pulling back another 1% overnight to finish just above the $72USD per barrel level. The previous daily candle was a worrisome bearish engulfing candle that didn’t close below the low moving average but this candle has so we are likely to see this rollover further and possibly retest the previous lows at the $68 level:
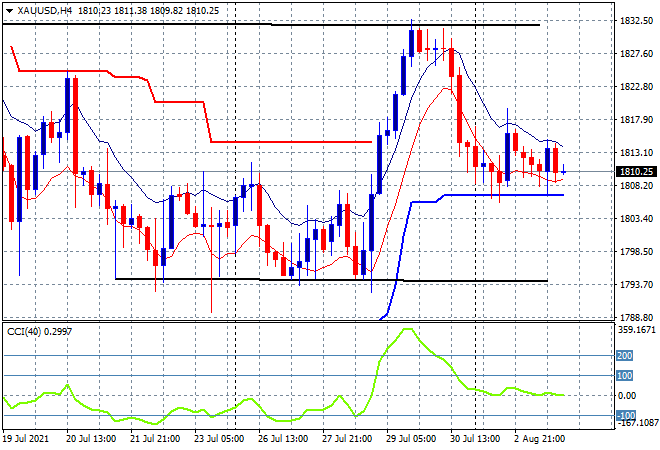
Gold is just holding on here, not finding the extra buying support it needs to push higher out of its recent slump, retracing back towards the short term ATR trailing support level and $1800USD per ounce level as it fails to make any new daily highs. Daily and four hourly momentum remains nominally positive so there is potential for another crack higher but overall this market remains in a bear phase until the $1830 level can be breached:
Glossary of Acronyms and Technical Analysis Terms:
ATR: Average True Range – measures the degree of price volatility averaged over a time period
ATR Support/Resistance: a ratcheting mechanism that follows price below/above a trend, that if breached shows above average volatility
CCI: Commodity Channel Index: a momentum reading that calculates current price away from the statistical mean or “typical” price to indicate overbought (far above the mean) or oversold (far below the mean)
Low/High Moving Average: rolling mean of prices in this case, the low and high for the day/hour which creates a band around the actual price movement
FOMC: Federal Open Market Committee, monthly meeting of Federal Reserve regarding monetary policy (setting interest rates)
DOE: US Department of Energy
Uncle Point: or stop loss point, a level at which you’ve clearly been wrong on your position, so cry uncle and get out!