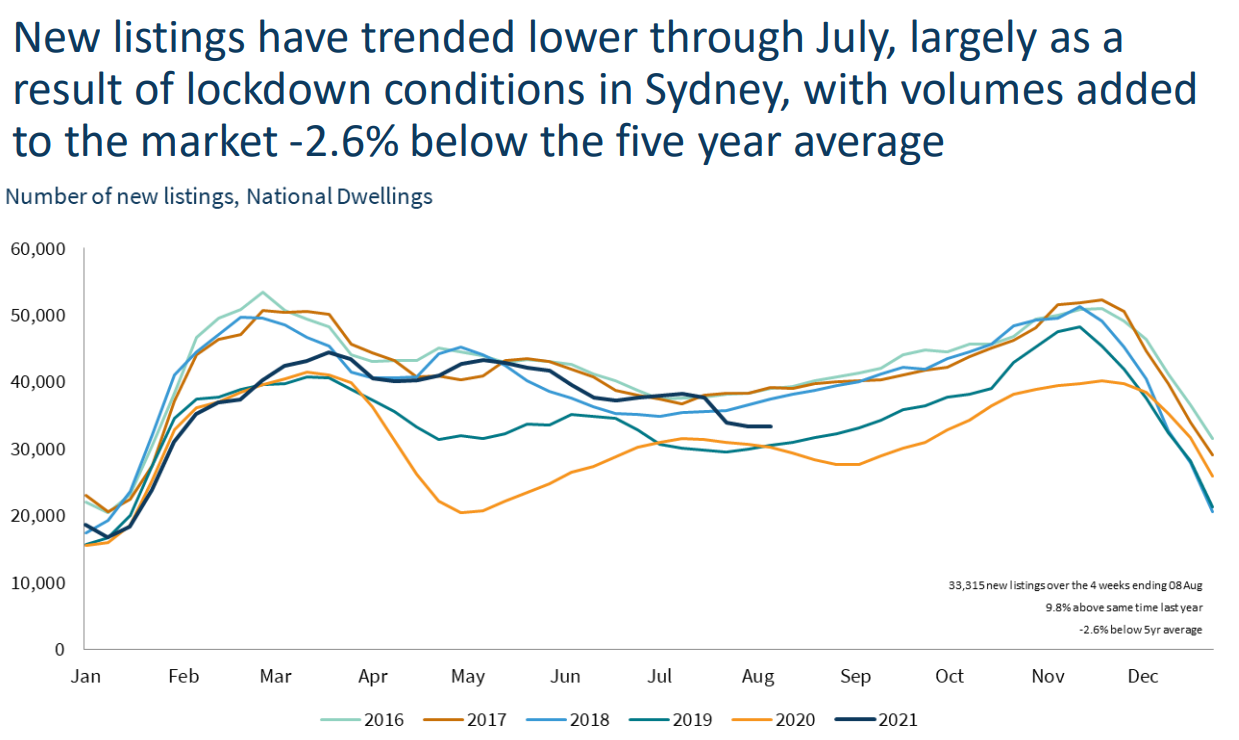
CoreLogic has released its Monthly Housing Chart Pack, which shows that new listings were running 2.6% below the five-year average in July 2021:

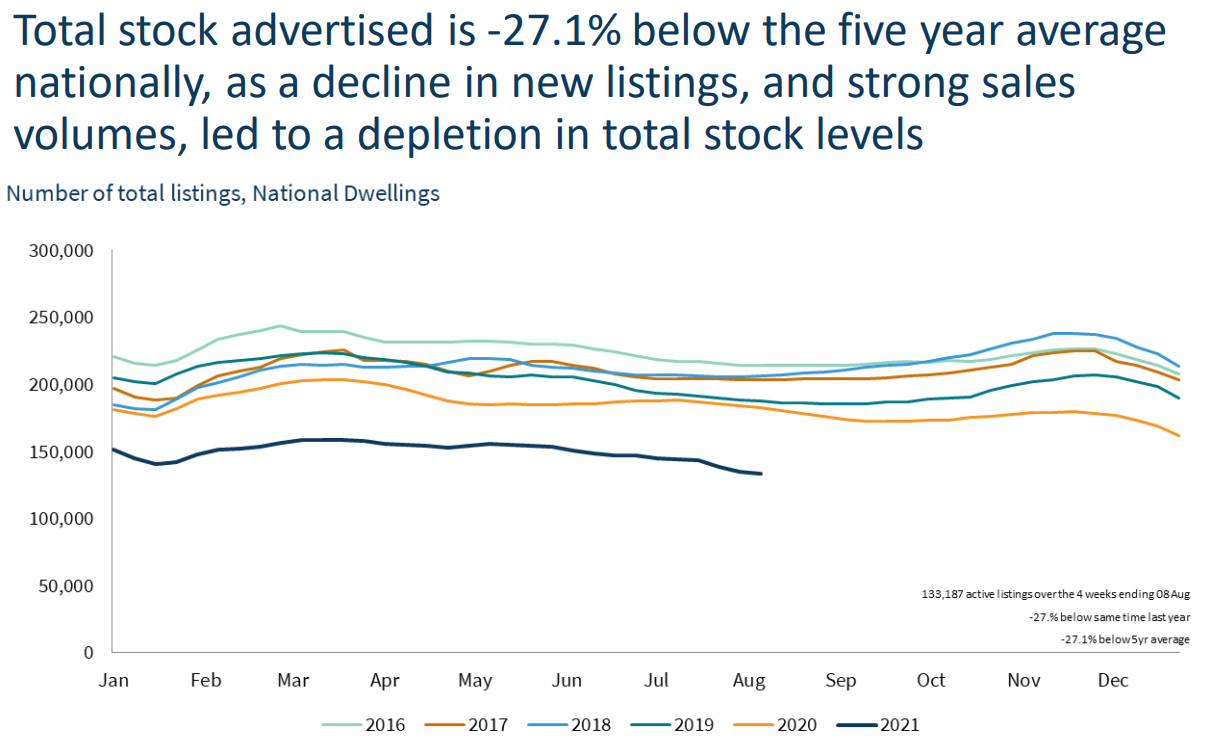
More importantly, the total number of homes for sale is running 27.1% below the five-year average:

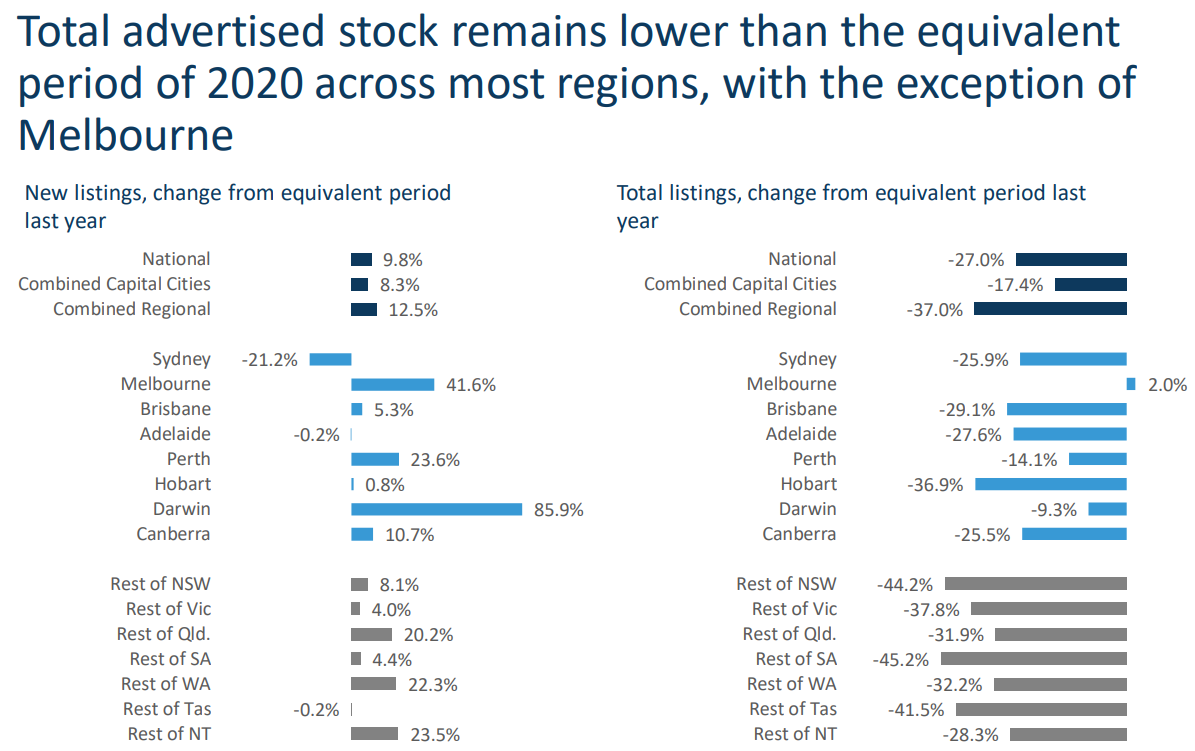
At the jurisdictional level, annual stock levels have fallen across every market except Melbourne, which was in hard lockdown at the same time in 2020:

At the same time, sales volumes are running a whopping 42.6% above the five year average:

Moreover, the average number of days taken to sell a home has shrunk from 51 days in July 2020 to just 29 days in July 2021:

No wonder Australian property values are rising so fast with record low mortgage rates (see next chart) running head long into a scarcity of stock:

FOMO is ruling the market.
- Australia Institute demolishes wage-inflation scaremongers - May 18, 2022
- Roy Morgan unemployment jumps to 9.7% - May 18, 2022
- IMF: New Zealand’s housing bust threatens economy - May 18, 2022