Advertisement
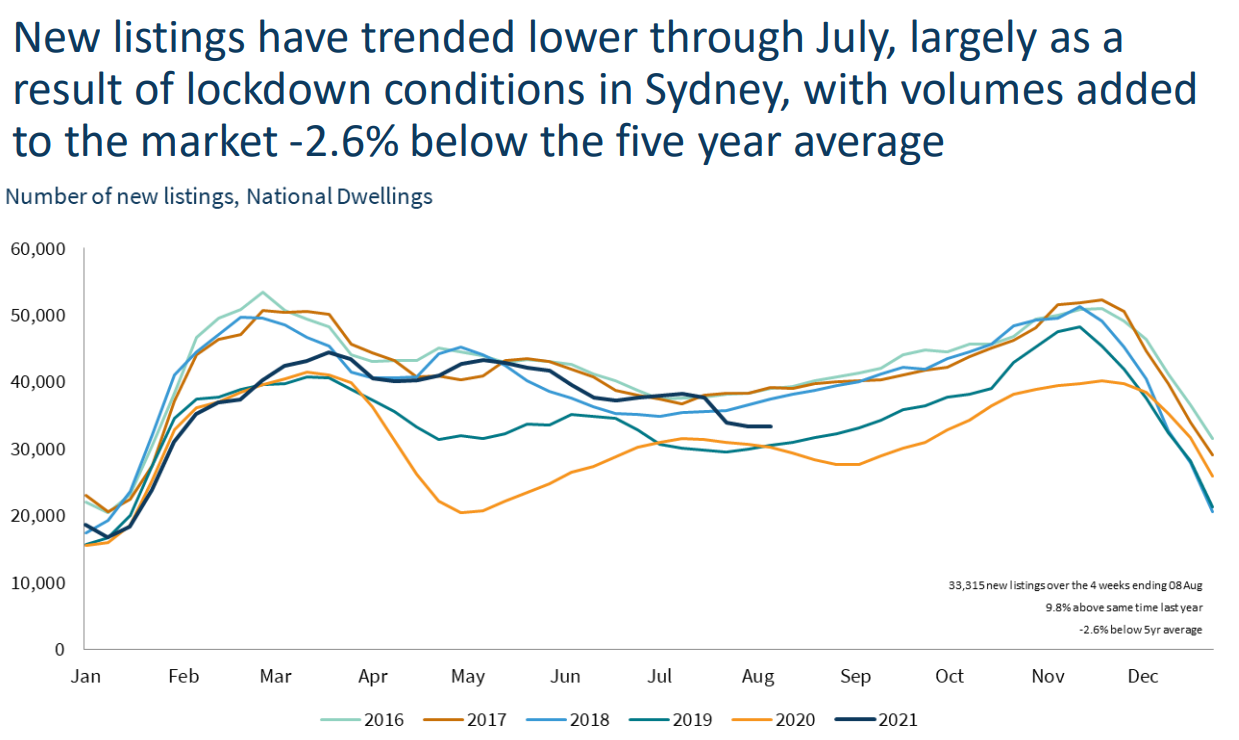
CoreLogic has released its Monthly Housing Chart Pack, which shows that new listings were running 2.6% below the five-year average in July 2021:
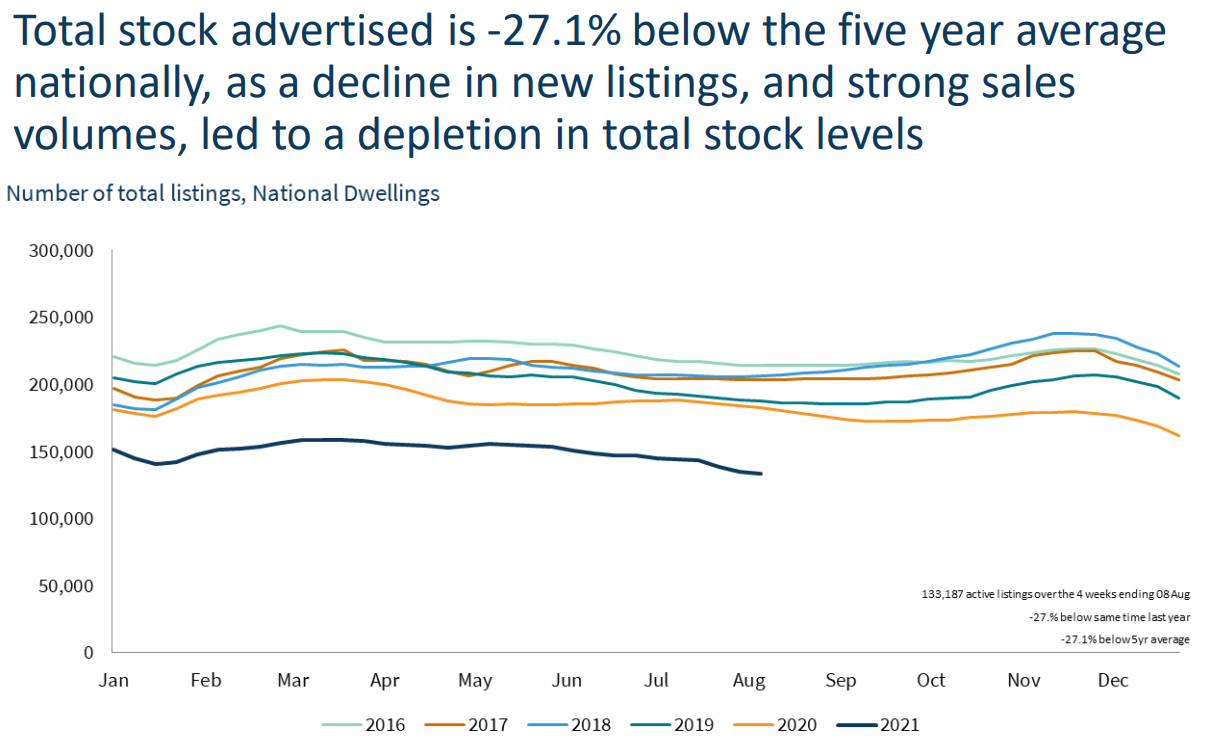
More importantly, the total number of homes for sale is running 27.1% below the five-year average:
Advertisement
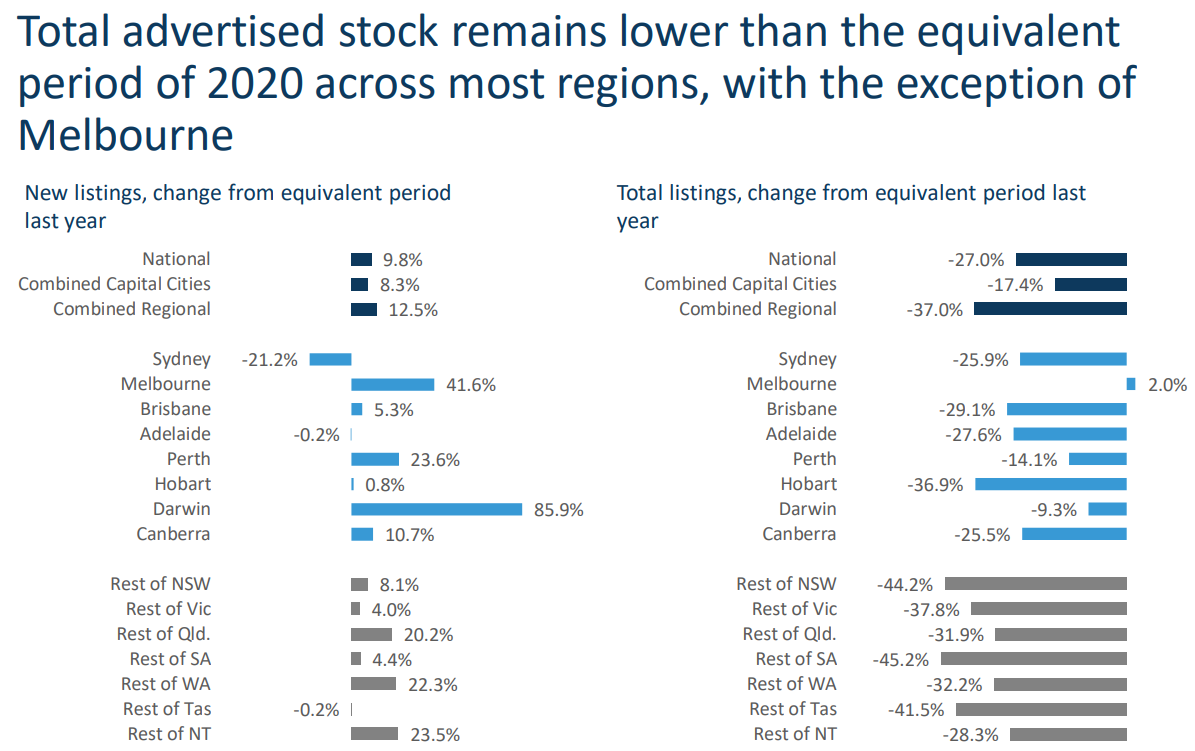
At the jurisdictional level, annual stock levels have fallen across every market except Melbourne, which was in hard lockdown at the same time in 2020:
The full text of this article is available to MacroBusiness subscribers
Cancel at any time through our billing provider, Stripe
About the author

Leith van Onselen is Chief Economist at the MB Fund and MB Super. He is also a co-founder of MacroBusiness.
Leith has previously worked at the Australian Treasury, Victorian Treasury and Goldman Sachs.
Advertisement