
Friday night was relatively mixed for risk markets with Wall Street putting in a new record high while European bourses were mixed as economic news was also mixed amid the coming of the triple witching month/quarter/year. Treasury yields jumped on the latest PCE inflation print, up over 10bps while commodity prices were mixed as oil tried and failed to breakout while copper and gold lifted slightly.
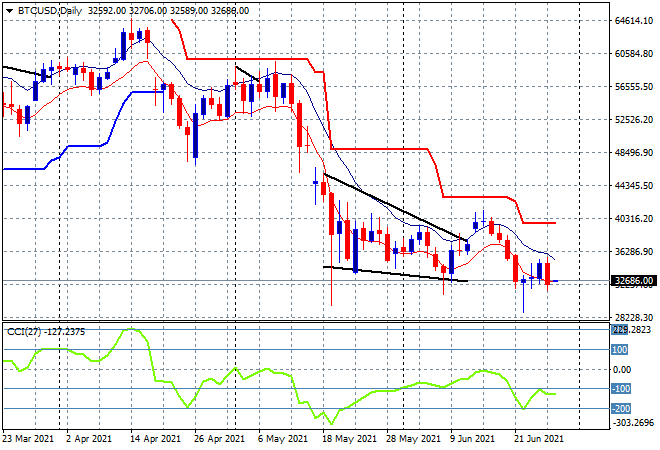
Bitcoin cannot escape the clutches of the doomsayers with price last week hovering around the $33K level and failing to make a new high. Daily momentum remains oversold with the overall setup ready to break lower:
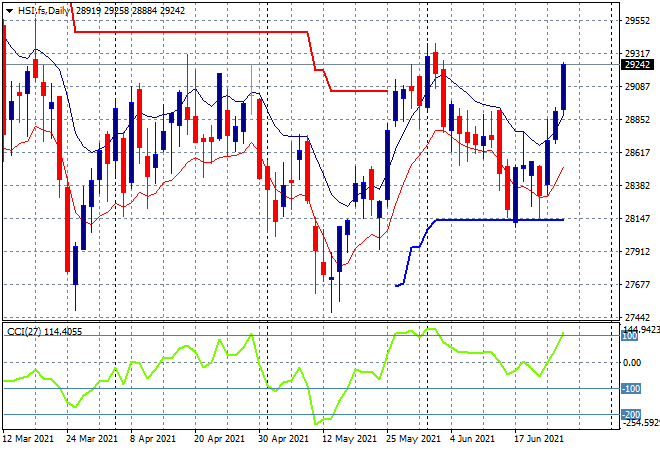
Looking at share markets in Asia from Friday’s session, where the Shanghai Composite lifted sharply again, up more than 1% to 3607 points, while the Hang Seng Index went even further, finishing 1.4% higher at 29288 points. Price action has broken out decisively here above the moving average band after bouncing off ATR daily support at the 28000 point level. The target to watch here is the previous weekly highs at the 29400 level that if broken will signal a big new trend:
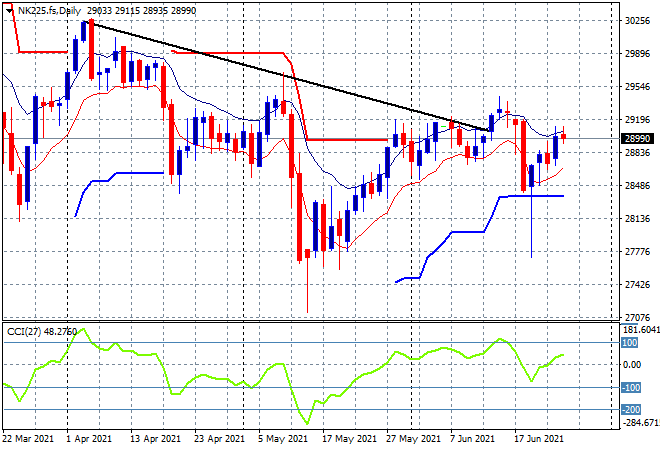
Japanese stocks had a solid finish to the week with the Nikkei 225 closing 0.6% higher at 29066 points. Daily futures are suggesting a flat start to the week, despite a strong finish on Wall Street as heavy resistance remains at the 29000 point level as a slightly stronger Yen continues to weigh:
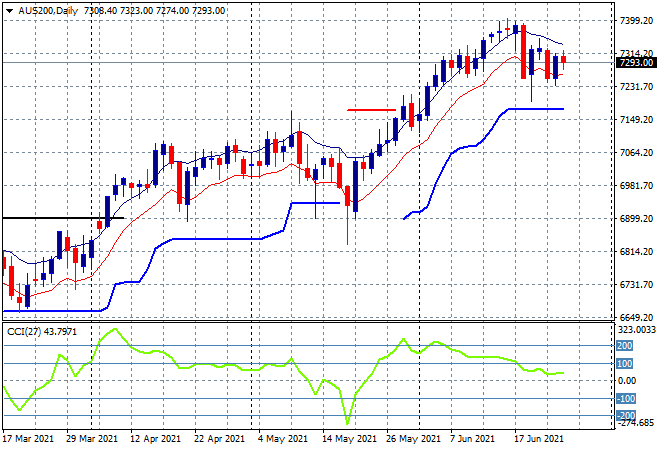
Australian stocks were able to shrug off further COVID restrictions with the ASX200 lifting 0.5% to finish just above the 7300 point level. SPI futures are up only 5 points with momentum readings remaining positive but neutral with a possible bounce off trailing ATR support at 7150 points likely:
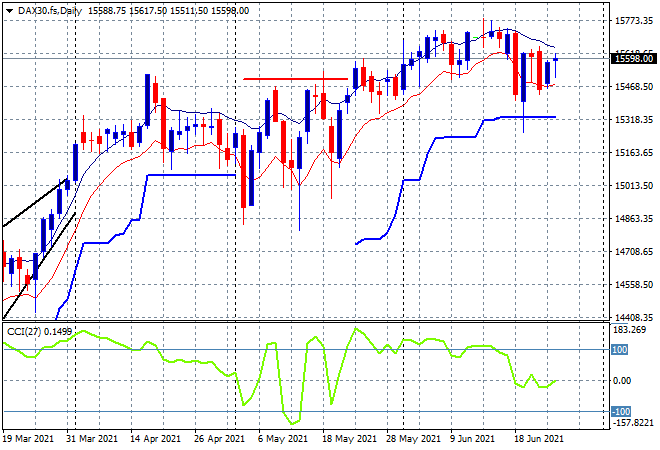
European markets remain poised here after some mid week turbulence with the German DAX only gaining 0.1% to 15607 points. Daily ATR support remains firm at the 15300 point level, but notably resistance is also very strong overhead at the 15700 point level so this looks more like containment rather than any new trend higher:
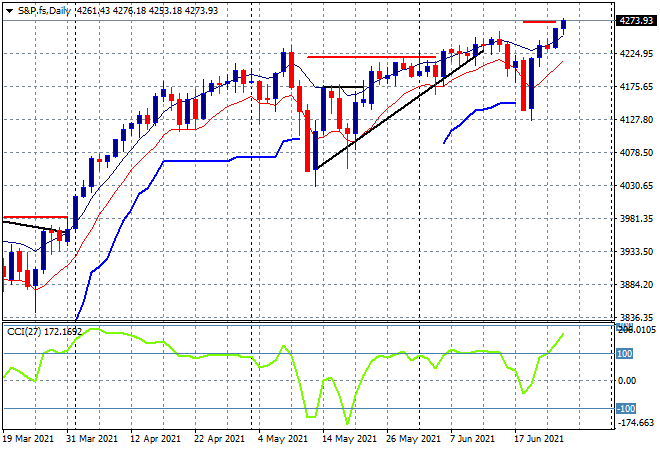
Wall Street is picking up the pace however although the NASDAQ put in a scratch session while the broader S&P500 lifted a solid 0.3% to surpass its previous highs yet again and continue its breakout above the key resistance level at 4250 points. Price action on the daily chart is ready for more highs:
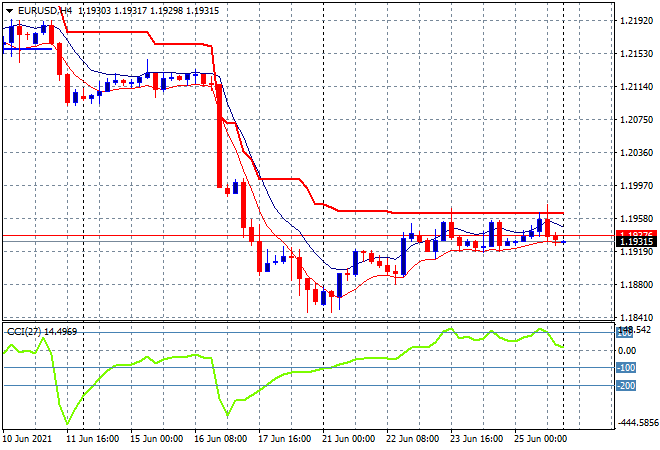
Currency markets remain in a holding pattern with USD unable to break any of the majors from their current path, as Euro holds on just the 1.19 handle on Friday night. While another rollover is always possible, watch for any break above trailing four hourly ATR resistance above to define a new trend higher:
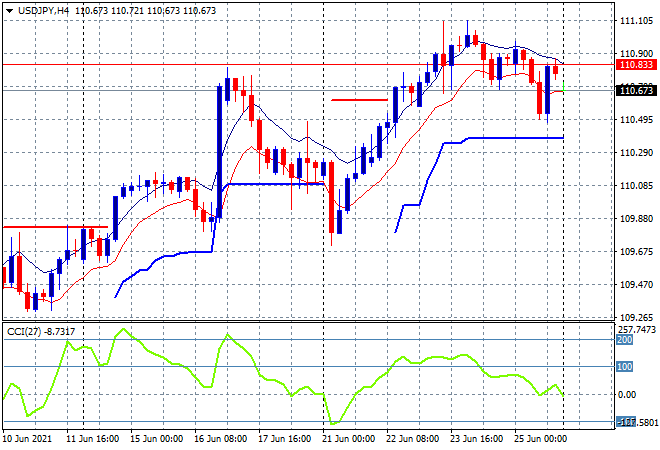
The USDJPY pair continues to find heavy resistance at the 111 handle with a midweek trend transition placing it in a holding pattern as well. Another confused chart that should be pointing to more upside but there is some point of control action going around the 110 handle here that could spark some more volatility so I’m wary of an upside position just yet:
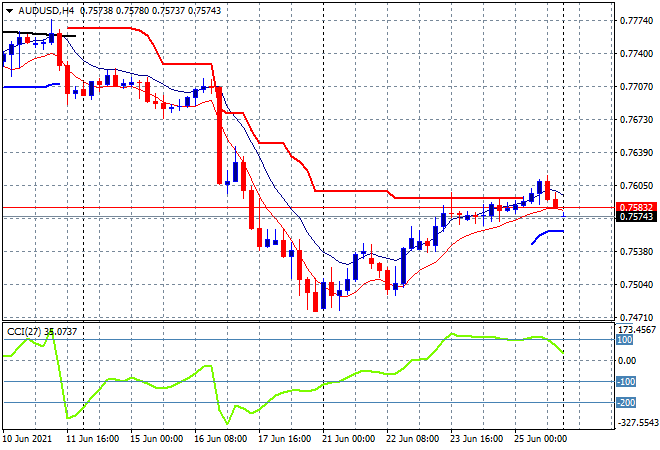
The Australian dollar was trying to find more life, with the swing above the 75 handle on classic oversold price action continuing to stall out at overhead ATR resistance on the four hourly chart. This still keeps it well below the March lows but momentum and price action is pointing to more downside if we don’t see another strong close above the high moving average on the four hourly chart soon:
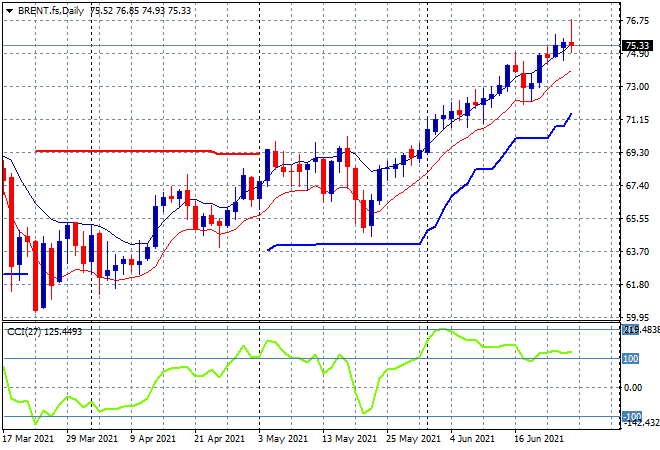
Oil prices tried to push higher on Friday night but sold off with Brent crude initially getting back above the $76USD per barrel level before retracing back to the recent daily high. Price remains strongly supported in this uptrend, with momentum nicely overbought and not over extended as yet, with the 2018 high at $83 still on target:
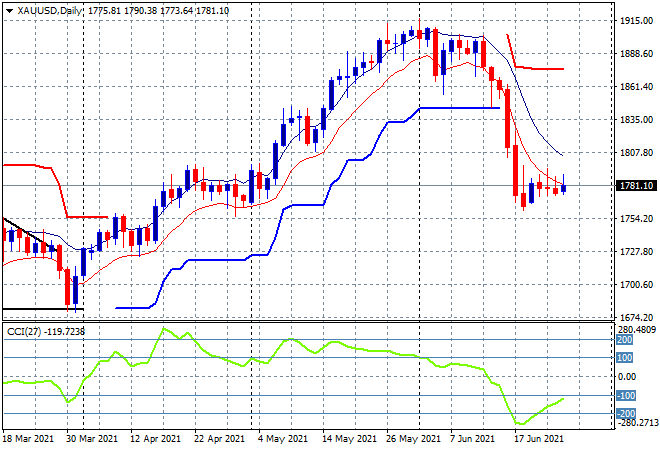
Gold remains in the doldrums gaining a few dollars to close the week out at the $1781USD per ounce level. Turn this daily chart upside down and you’d be very bullish as tight daily sessions continue to bunch up around the $1760-1780 level with no new daily highs. The downside target at the April lows at $1670 are not far away – watch for any close below the recent lows as a signal:
Glossary of Acronyms and Technical Analysis Terms:
ATR: Average True Range – measures the degree of price volatility averaged over a time period
ATR Support/Resistance: a ratcheting mechanism that follows price below/above a trend, that if breached shows above average volatility
CCI: Commodity Channel Index: a momentum reading that calculates current price away from the statistical mean or “typical” price to indicate overbought (far above the mean) or oversold (far below the mean)
Low/High Moving Average: rolling mean of prices in this case, the low and high for the day/hour which creates a band around the actual price movement
FOMC: Federal Open Market Committee, monthly meeting of Federal Reserve regarding monetary policy (setting interest rates)
DOE: US Department of Energy
Uncle Point: or stop loss point, a level at which you’ve clearly been wrong on your position, so cry uncle and get out!