
Wall Street took another hit on Friday night, unable to translate record highs into yet more record highs as inflationary pressures continue to mount in the US economy. Consumer sentiment, spending and other measures are all pointing to a greater than expected inflation pulse with the USD gaining strongly against the major currencies after a tepid week. US Treasury yields pulled back, still elevated but in a tighter trading range while commodities finally moved lower with oil and iron ore both fell nearly 2% as gold failed again to get through the critical $1800USD per ounce barrier.
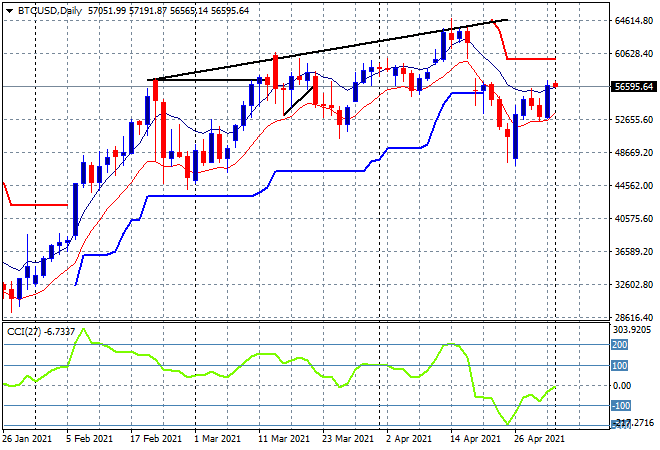
Bitcoin was able to clawback most of its early week losses as it finished just below the $57K level on Friday night. The daily chart shows a lot of support building at the $45-48K zone as it tries to get back above the $60K level:
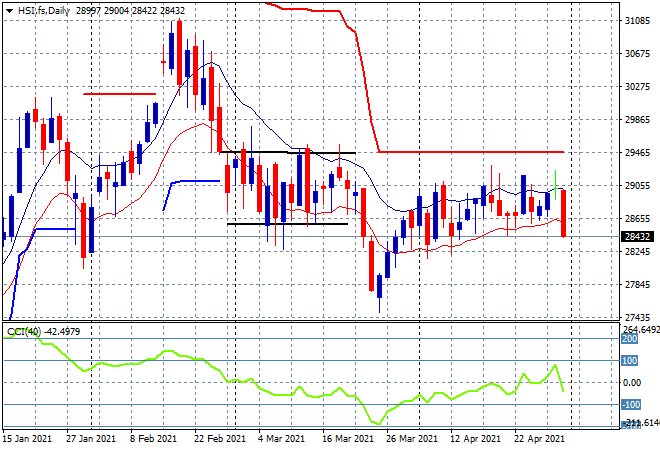
Looking at share markets in Asia from Friday’s session where Chinese markets saw a lot of selling post the PMI print with the Shanghai Composite closing down 0.8% to 3441 points while the Hang Seng Index took back all its recent gains and then some, finishing 2% lower at 28724 points, definitively rejecting resistance at the 29000 point level.The daily chart shows this rejection in full with no new daily or weekly highs as momentum goes back into negative mode after recently pointing to a possible bottom pattern. The key level to break remains ATR daily resistance way above (solid red line) and that’s not happening anytime soon:
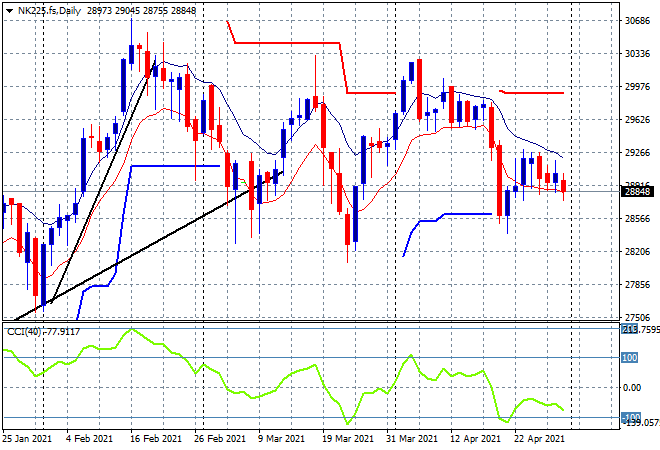
Japanese markets were closed on Friday and will remain closed for most of the week with the daily chart of the Nikkei 225 showing a lot of hesitation and inability to make a definitive breakout. The bias is to the downside although the last daily low was above the previous weekly low so there should be some more support at the 28000 point level:
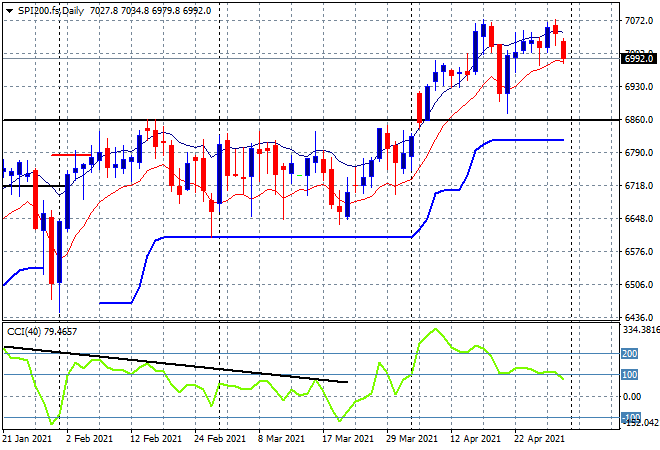
The ASX200 was down nearly 1% going into the close on Friday, threatening the 7000 point level before closing only 0.8% lower at 7025 points. SPI futures however are indicating a breakdown below the key level on the back of the losses on Wall Street. The daily chart now shows momentum retracing from the previous overbought levels and the low moving average coming under threat which could stall this rally above the previous breakout levels (solid horizontal black line). Is it Sell in May time as I asked last week are we reaching a top here?
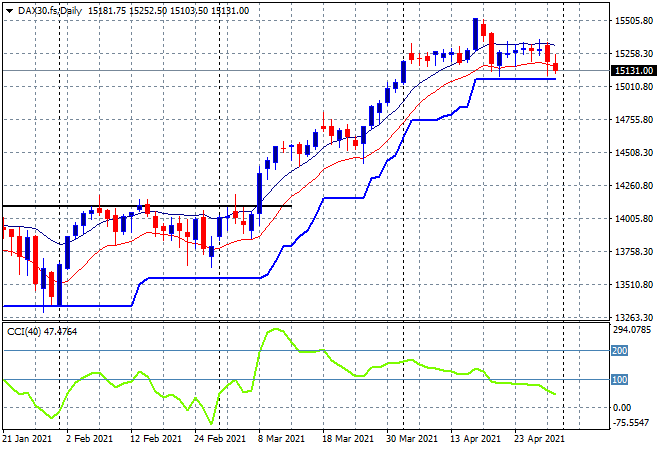
European markets continued the Asian selloff on Friday with only the FTSE gaining on the back of an upbeat business conditions print with the EZ wide GDP and CPI release coming out as expected. This dampened risk spirits slightly with the German DAX losing 0.1% to close the week at 15135 points. Sentiment has been paring back from nominally bullish to neutral with daily ATR support still remaining firm at the 15000 point level but caution reigns here as momentum readings continue to subside and are possibly suggesting a breakdown below:
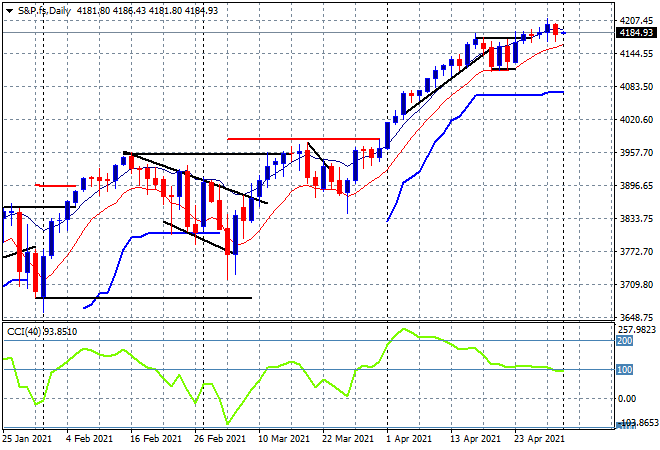
Wall Street sold off even more in the wake of the PCE and consumer sentiment prints as they broadcasted that the Fed may have to tighten earlier than expected. The NASDAQ lost nearly 1% while the S&P500 finished 0.7% lower to break back below the 4200 point level after getting to a new record high during the week. The daily chart doesn’t really spell much danger ahead, although daily momentum is now waning a little, its still very positive and support at the 4100 point level remains very strong:
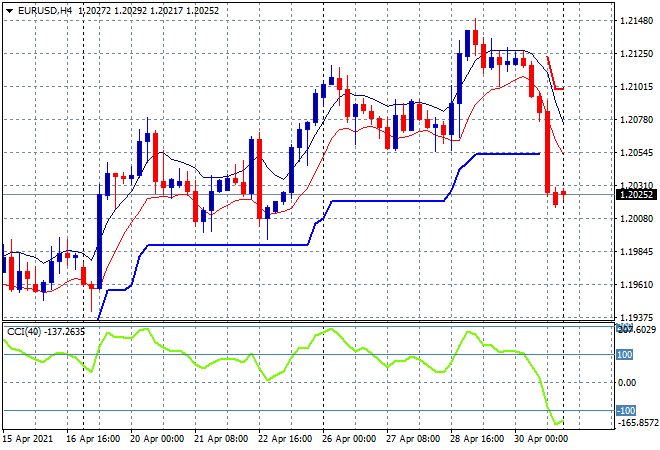
Currency markets reversed their volatility yet again with a big surge in USD against everything, especially Euro, which lost all of its gains for the week in a matter of hours. The union currency was slammed back to the 1.20 handle, losing over 100 pips on Friday night with short term support at the 1.2060 level taken out. Momentum is now nicely oversold and could spell more trouble below as expectations pivot 180 degrees:
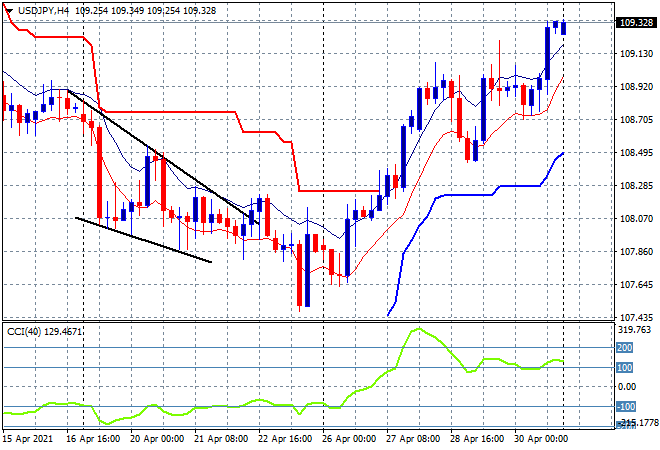
The USDJPY pair brokeout above the 109 handle as well but not as far relatively speaking as Euro’s breakdown. Momentum remains nicely overbought but the lack of buying support as Japanese traders take half the week off might cause a stall here before anymore upside, yet weekly highs have been taken out so the medium term technical picture is looking good:
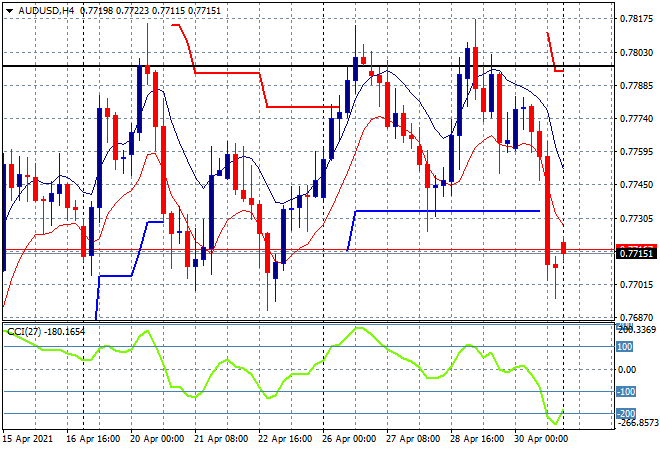
The Australian dollar sold off sharply which was no surprise given the amount of times its hit resistance at the 78 cent level and forming a very strong bearish triple top pattern on the four hourly chart. The Pacific Peso was pushed straight to the 77 handle – the lower bound of its recent channel – where its likely to bounce a little higher this morning:
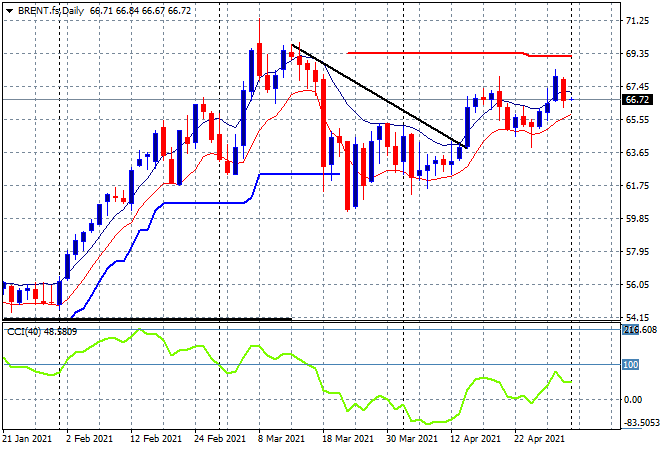
Oil prices retraced all of their previous gains with Brent losing 2% to bring it back into the $66USD per barrel area after recently making a new weekly high as resistance overhead at the $67 level was seemingly pushed aside. The waiting period may be over here as price tries to regain the March former highs above the $70 level next – watch for support at the low moving average to firm here:
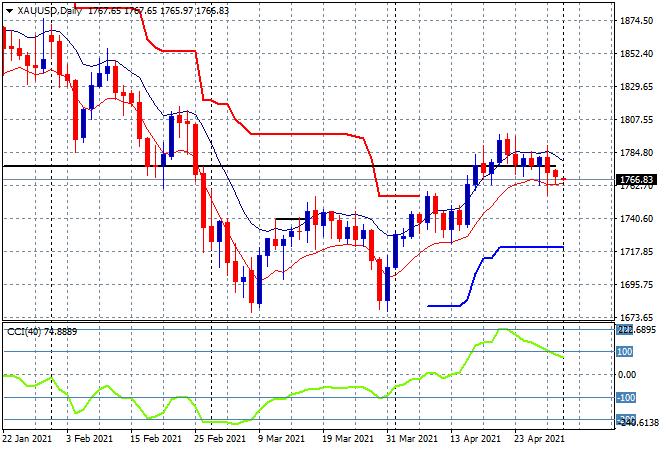
Gold again failed to gain any upside traction but even with a much stronger USD the tight trading session saw it only lose a few dollars to finish the week at $1766USD per ounce, still shy of both the psychologically important $1800USD per ounce and previous support now resistance area just below that level at the February lows (solid horizontal black line) :
Glossary of Acronyms and Technical Analysis Terms:
ATR: Average True Range – measures the degree of price volatility averaged over a time period
ATR Support/Resistance: a ratcheting mechanism that follows price below/above a trend, that if breached shows above average volatility
CCI: Commodity Channel Index: a momentum reading that calculates current price away from the statistical mean or “typical” price to indicate overbought (far above the mean) or oversold (far below the mean)
Low/High Moving Average: rolling mean of prices in this case, the low and high for the day/hour which creates a band around the actual price movement
FOMC: Federal Open Market Committee, monthly meeting of Federal Reserve regarding monetary policy (setting interest rates)
DOE: US Department of Energy
Uncle Point: or stop loss point, a level at which you’ve clearly been wrong on your position, so cry uncle and get out!