By Gareth Aird, head of Australian economics at CBA:
Key Points:
- The Australian economic data dump this week added weight to our view that wages and inflation outcomes will be stronger than the RBA has forecast.
- The Q1 21 wage price index printed a little higher than market expectations and indicates that underlying wages growth is running at a six month annualised pace of2.0%.
- Both the unemployment and underemployment rates dropped in April to leave underutilisation at its lowest level since December 2019.
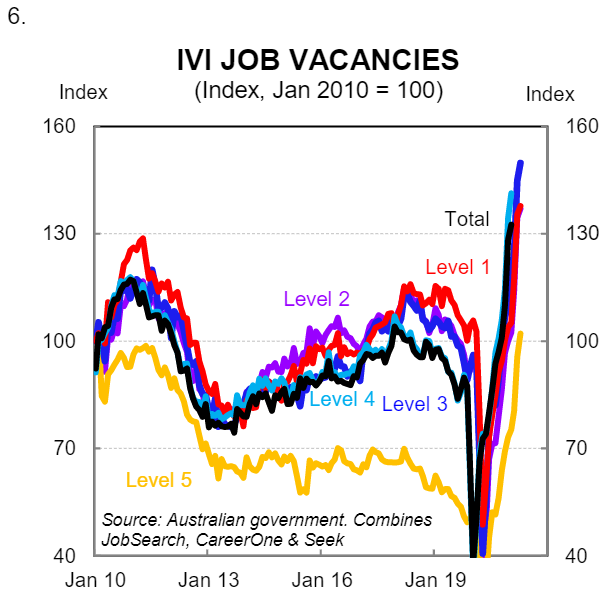
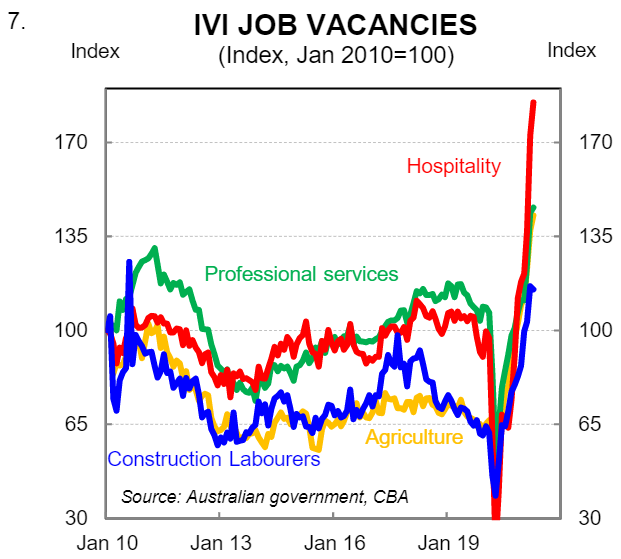
- The Government’s internet vacancy index popped again in April confirming that forward looking indicators of labour demand are red hot.
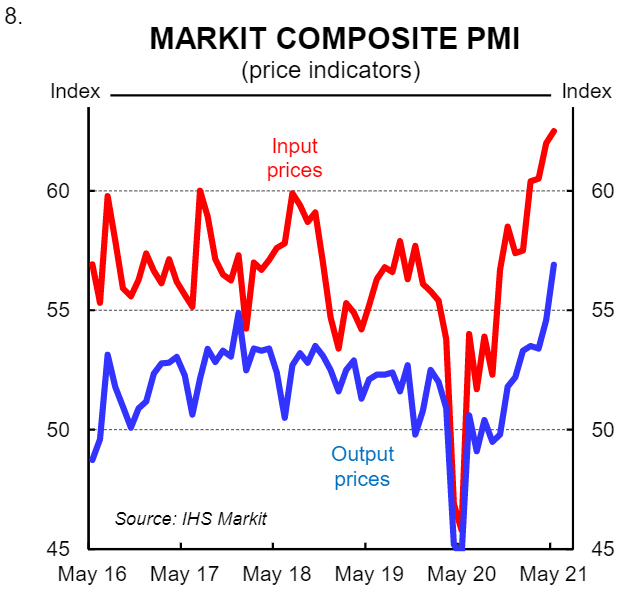
- The Markit “Flash” PMIs were very strong in May and the inflation gauges have rocketed higher for both input and output prices.
Overview
Key domestic economic data released over the week largely pertained to the labour market which feeds into the inflation debate. The slew of information was all supportive of our view that wages growth and inflation outcomes will exceed the RBA’s forecasts over the next few years.
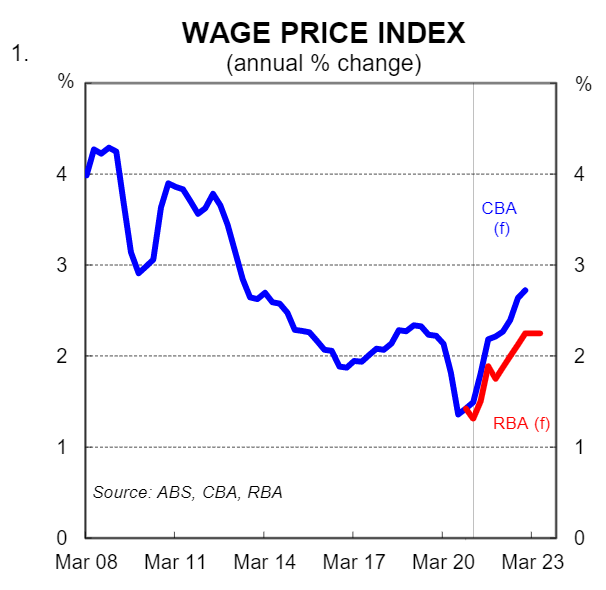
To be clear, we have not forecast a big lift in wages or inflation in the near term. But our expectations for underlying inflation to lift to 2¼%/yr by end-2022 and for wages growth to be travelling at 2¾%/yr at that point challenges the RBA’s “2024 at the earliest ”forward guidance on the cash rate(chart 1).
This note is a little wrap of the Aussie data this week with an emphasis on the inflationary components.
Wage Price Index(WPI), Q1 2021
The Q1 21 WPI rose by 0.6% which was a little firmer than the 0.5% market median forecast. The annual rate stepped up a touch to 1.5%.
A quirk in the way the Fair Work Commission’s 1.75% increase in the minimum wage was applied in 2020/21 means that changes to award wages were a big drag on the headline Q3 20 WPI while they resulted in a boost to the Q4 20 and Q1 21 wage readings (the headline WPI is a seasonally adjusted figure and there is normally a large seasonal boost to the WPI from the lift to award wages in the September quarter each year –see chart 2).
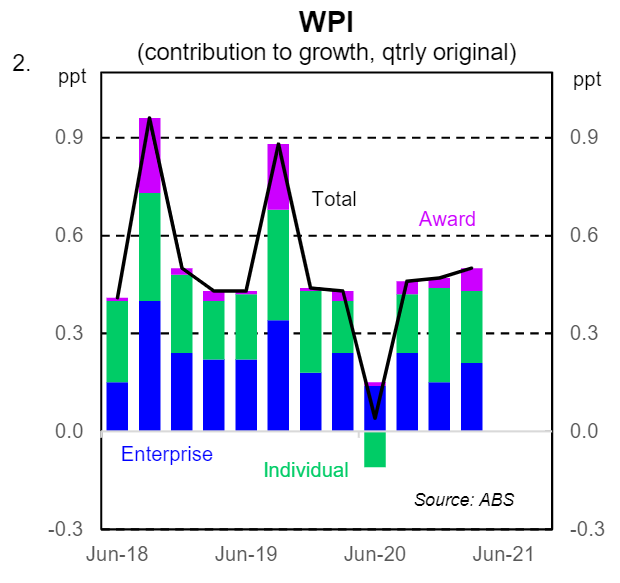
The upshot is that underlying wages growth is estimated to be running at ~2.0% on a six month annualised basis. And more importantly, wages growth is on a gentle and sustainable upward trend. The RBA’s updated forecasts in the May Statement on Monetary Policy (SMP) put the WPI at 1.5%/yr at mid-2021. To achieve that outcome the Q2 21 WPI would need to print at just 0.2%/qtr which would be completely at odds with current underlying wage outcomes.
Put another way, the RBA’s near term wages forecasts should be comfortably bettered and a mark-to-market exercise will see the RBA upwardly revise their profile for wages growth in the August SMP. The RBA will probably be reluctant to upwardly revise their forecast profile for the WPI by anything greater than ¼ppts. But it will be yet another further revision following the small upward revision in the May SMP. In essence it will be a recognition that wage outcomes have to date come in stronger than their expectations, which is after all the result that they desire.
Labour force survey, April
The April labour force survey was consistent with our expectations that the labour market is tightening quickly and that in turn will see wage outcomes push higher.
The headline fall in employment of 31k was disappointing. But despite the fall in employment the number of people unemployed dropped by 26k. This meant that the unemployment rate dipped by 0.1ppt to 5.5%. And in a further sign that the labour market is tightening quickly the underemployment rate moved lower by 0.2pptsto 7.8%-its lowest level mid-2014 (chart 3).
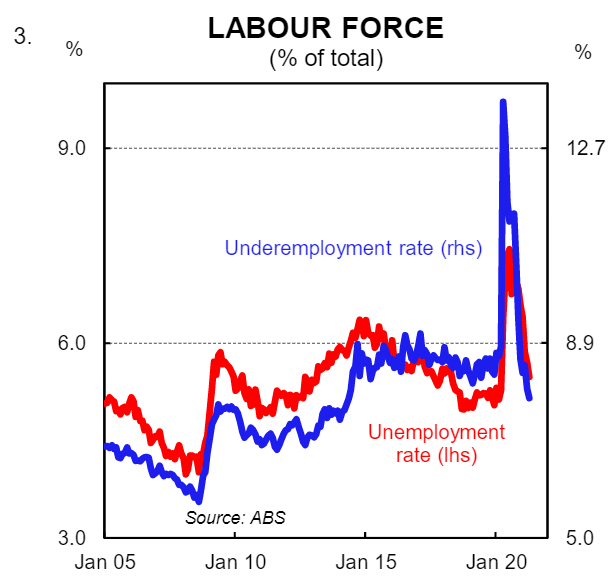
There has been a lot of focus more recently on the NAIRU. And regular readers will know that we believe the NAIRU has lifted over the COVID-19 period for two reasons: (i) the international borders are closed which means that net overseas migration has dropped sharply and therefore skill shortages have more chance of manifesting themselves if firms are not able to recruit from a global pool of labour; and (ii) the spread between the unemployment rate and the underemployment is narrowing (chart 3).
The sum of the unemployment and underemployment rates produces the underutilisation rate which is the broadest measure of labour market slack. It is also the measure of labour market slack that is most correlated with wage outcomes (see chart 4).
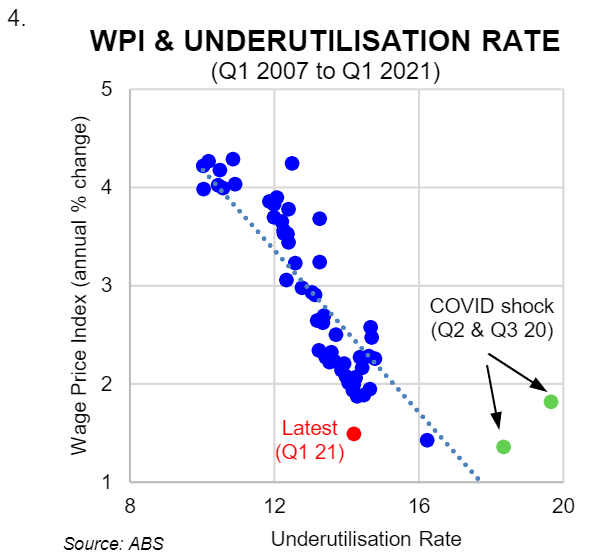
The underutilisation rate dropped to 13.3% in April which was its lowest level since December 2019. That rate of underutilisation is consistent with wages growth of~2¼%. Wage outcomes are currently tracking lower than that. But base effects are playing a role due to wage freezes in the middle of last year. We expect the relationship between underutilisation and wages growth to reassert itself in coming quarters which will see wages growth step up.
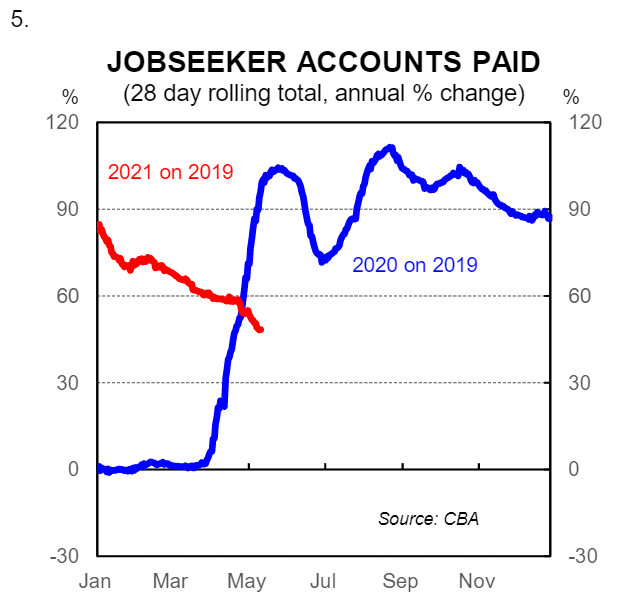
It is worth noting that our data on JobSeeker payments indicates that the number of people receiving unemployment benefits has continued to trend lower since the expiry of JobKeeper (chart 5 -CBA latest data to 14 May).
Internet Vacancy Index (IVI), April
Markit “Flash” PMIs, May