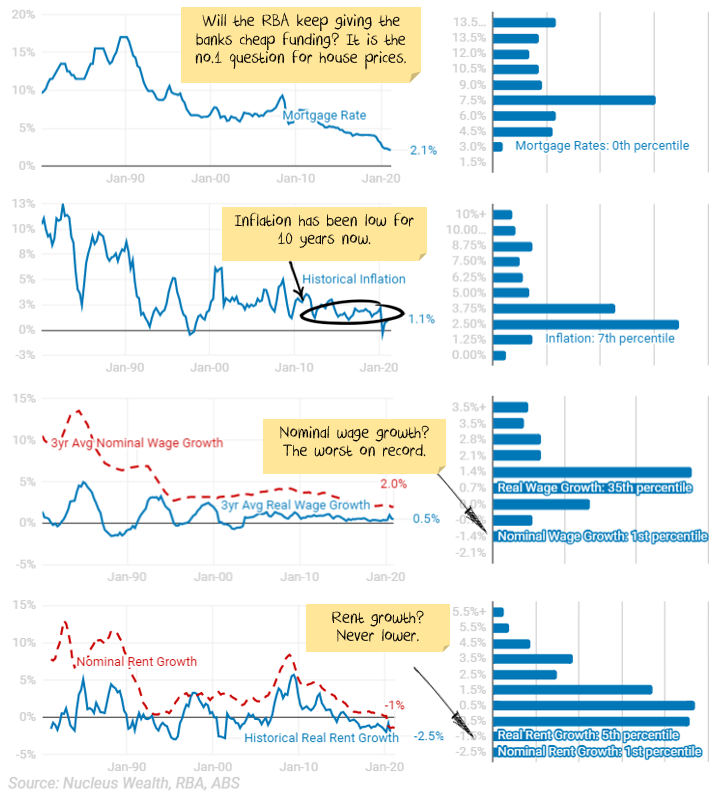
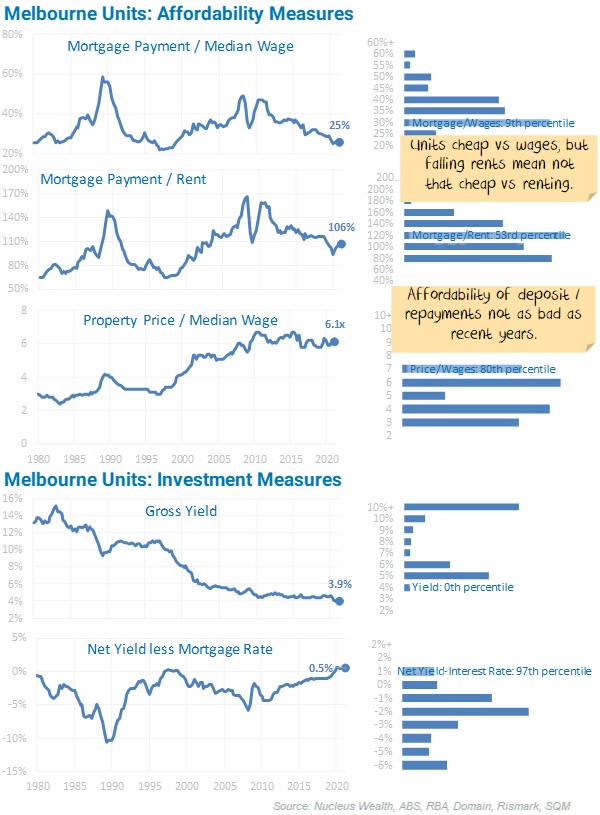
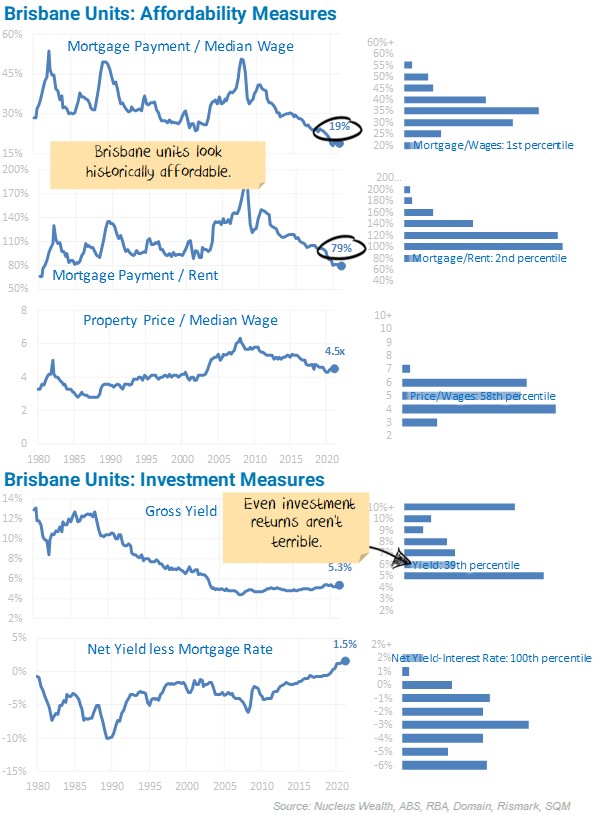
The left chart shows each of the ratios used for forecasting in the property calculator over 40 years. The histogram on the right shows the distribution of the same ratio over the 40 years.

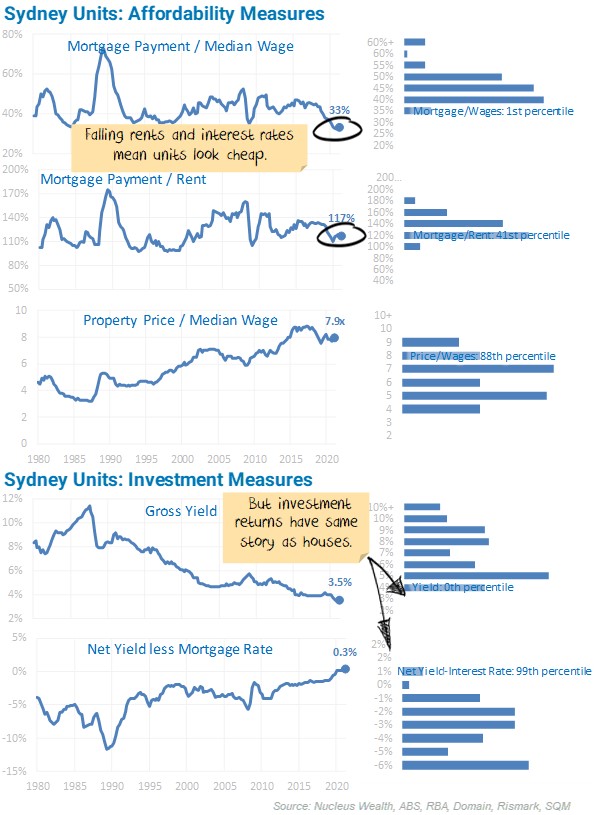

Australian property market prices continued to climb over the last month, and mortgage interest rates stayed constant. There are some extraordinary divergences in affordability. It has never been cheaper in most markets to service a mortgage, but never more expensive to save for a deposit or pay off the loan. In general, housing valuation and affordability statistics are improving outside of Sydney houses. For investors, rental yields have never been lower in an absolute sense, never higher relative to mortgage rates.
The net effect is that the Federal Government and Reserve Bank have successfully distorted conditions to encourage as many people as possible to borrow as much as possible. An investment in housing is basically a vote of confidence in their ability to keep force-feeding the market.
We run an Australian property market calculator to help investors or potential homeowners determine the returns on Australian property. The idea we want to illustrate is that there are a number of key inputs into housing valuation, but that interest rates are the most important.

This is the confusing part. There are effectively two different interest rates at the moment, the floating rate and the three-year fixed rate.
We note the European Central Bank introduced the same mechanism in 2014 and has never been able to remove it. It started with 0.1% funding for banks in 2014. By 2016 the rate was -0.4%. Now, -1.0%. Yes, the central bank will pay commercial banks up to 1% if they can just find someone (anyone!!!) to borrow the money.
When you adjust the factors in our property market calculator, you find that with low inflation, wage growth and rent growth that interest rates become even more important for determining property prices. But forget about the cash rate. The important factor is the Term Funding Facility. At the moment, the Reserve Bank is planning on removing this facility in June which will likely increase the three-year rate by around 0.25%.
Keep in mind that I’m talking about forecasting residential property in aggregate – not individual houses or suburbs.
There are significant links between property prices and the availability of debt. The financial crisis showed this internationally. The Royal Commission into banking showed this in Australia. When the amount of debt available rises, so do property values. When debt slows down, property values fall.
The Federal Government is hellbent on forcing more debt onto borrowers. The Reserve Bank of Australia is providing the funding directly to banks. Credit is available.
I’m going to argue four other factors also constrain how high or low property prices can go. These are the four factors you can use to forecast property prices in our Australian property market calculator:
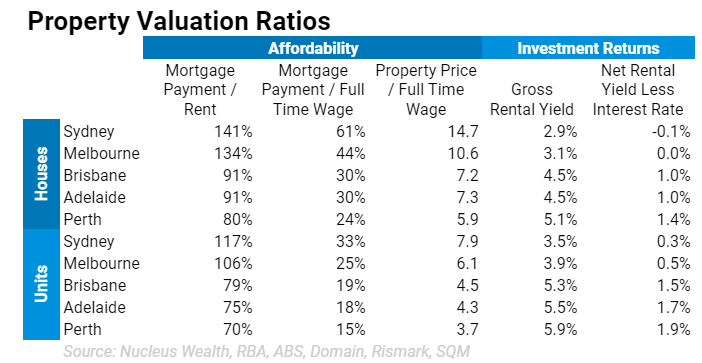
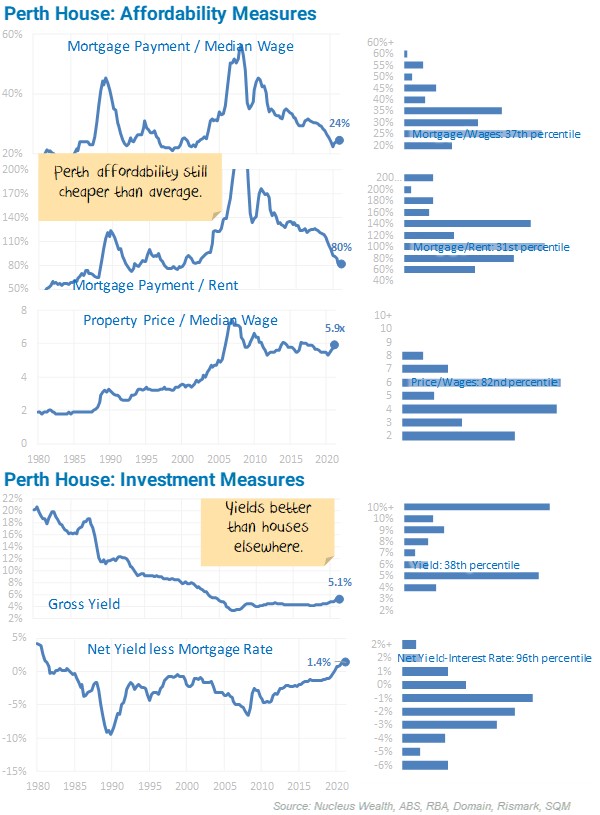
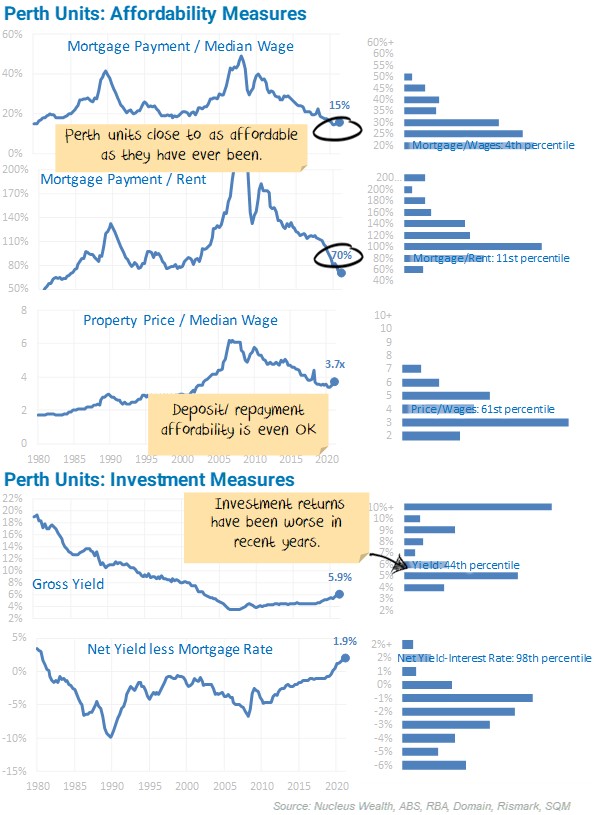
Melbourne and Sydney houses are the most expensive relative to longer-term measures. Most other cities are cheap. Affordability is best in Perth because prices have fallen so far over the last half-decade.
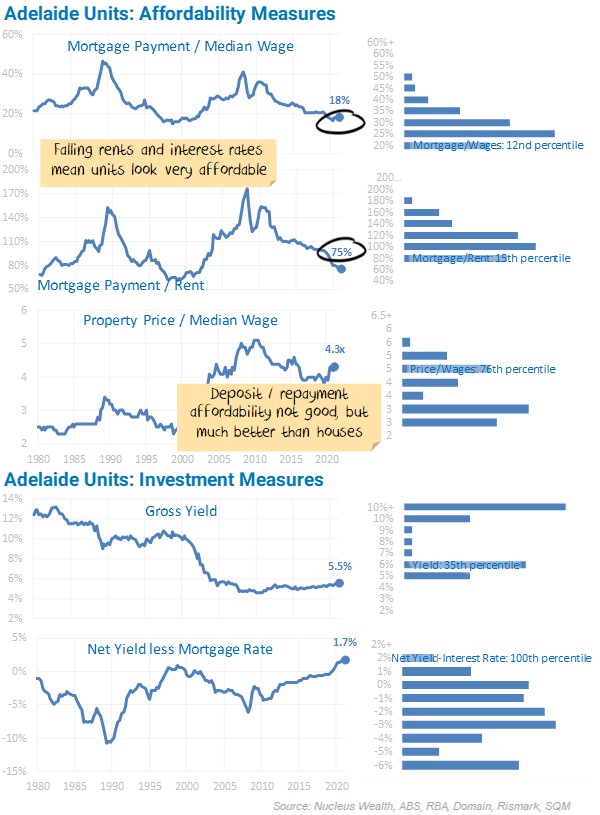
Within all cities a clear divergence is occurring between houses and units.
The left chart shows each of the ratios used for forecasting in the property calculator over 40 years. The histogram on the right shows the distribution of the same ratio over the 40 years.


It is a fascinating showdown.
On the one hand, we have plummeting immigration, high unemployment, and the end of eviction/mortgage payment moratoriums to deal with. Rental growth is as weak as it has ever been. And Australia starts with a larger private debt burden than just about any other country.
On the other, we have a burning political desire to keep Australian property market prices high and pump more debt into the economy. Inflation is low, as is wage growth, meaning interest rates can stay lower for longer. We have a roadmap to much lower interest rates to help. There is structurally higher demand for houses vs units due to the fear of more lockdowns.
Australia is stuck in a debt trap. We’ve got so much debt we can’t raise rates because it makes it more difficult for people to pay back debt. To get more growth we have to cut rates, so people borrow more and the cycle goes on.
The best hope for change? if mass New Deal-style work schemes push up earnings and growth comes from real spending power instead of debt. But that is a long way away.
In the meantime, there are other ways to keep the property party going. Once mortgages were for 20 years, then 25, now 30. Soon it will be 50. Japan has 100 year mortgages. Many people will never pay their mortgage back, so owning a home might become like renting – just that it’s renting from the bank.
This is a comparison of the cost of a mortgage with a 20% deposit, compared to the cost of renting the same house. By using this ratio to value house prices, we assume when the ratio gets high that people will prefer to rent rather than buy.
The consequence will be either (1) Australian property market prices will fall until it becomes more attractive for people to buy or (2) the Reserve Bank will lower interest rates and so the cost of a mortgage will decrease.
The benefit of using this ratio is it provides insight into the decisions both homeowners and investors are making. When the cost of a mortgage is cheaper than renting for a homeowner, or an investor can see their mortgage paid for by the rent, then prices tend up. Also, rent is a relatively stable series:

i.e. rents tend to go up a little more or a little less than inflation
The problem with using this series is that you can get significant changes in the series as central banks raise interest rates to slow the economy and then cut them to stimulate. It also ignores wage growth – strong wage growth supports higher prices. It ignores the higher deposits needed with higher house prices.

By using this ratio to examine housing valuation, you are assuming when the ratio gets high, people rent because they cannot afford to buy. The consequence will be either:
The benefit of using this ratio is that it provides a realistic impression of the decision many homeowners make: they spend as much as they can afford. Also, wages are even more stable than rents:
i.e. wages tend to go up a little more than inflation each year without much variation.
The problem with using this series is the same as the above: you can get significant changes in the series as central banks raise interest rates to slow the economy and then cut them to stimulate.
By using this ratio to look at housing valuation, you are assuming when the ratio gets high people rent because they cannot save enough money to afford a deposit. The consequence will be either:
The benefit of using this ratio is that it provides an additional dimension to the 2nd factor. Homeowners spend as much as they can afford, but they need to be able to save the deposit. This helps to indicate whether they can.
The problem with using this series is that it doesn’t incorporate falling interest rates or changes in rent. For this reason, I tend not to use this as my primary forecasting method, more of an additional check on the outcomes.
Rental yield is the annual rent divided by the property price. By using this ratio to look at housing valuation, you are assuming when the ratio gets low investors will not buy property as they are not getting a return that is high enough. The consequence will be either:
The benefit of using this ratio is that it provides a better indication of investor returns.
The problem with using this series is that it is hard to forecast. There is (probably?) a limit to how low yields can go, especially as there are only a few more rate cuts left. I would argue that the net (i.e. after subtracting costs) yield is a better indicator, but this is much harder to observe and requires guesswork. Another alternative would be the yield relative to something like a ten-year government bond. This would show the return for investors relative to other opportunities. However, if you wanted to forecast property prices that way, your first step would be predicting the 10-year bond rate. And that is making forecasting harder rather than easier. For these reasons, I tend not to use this as my main forecasting method. It is more of a supplementary check on the outcomes.
Nucleus Wealth has compiled this data using a range of different sources.
We use Domain for more recent data quarterly property prices and rents, cross-checked with SQM to fill any short-term moves. Older information is from Rismark and the Australian Bureau of Statistics to fill time series.
For economic data, we use either Reserve Bank of Australia or Australia Bureau of Statistics data. For older data, we have had to estimate some factors due to differing definitions over time.
————————————————-
Damien Klassen is Head of Investments at the Macrobusiness Fund, which is powered by Nucleus Wealth.
Follow @DamienKlassen on Twitter or Linked In
The information on this blog contains general information and does not take into account your personal objectives, financial situation or needs. Past performance is not an indication of future performance. Damien Klassen is an authorised representative of Nucleus Wealth Management, a Corporate Authorised Representative of Nucleus Advice Pty Ltd – AFSL 515796.