
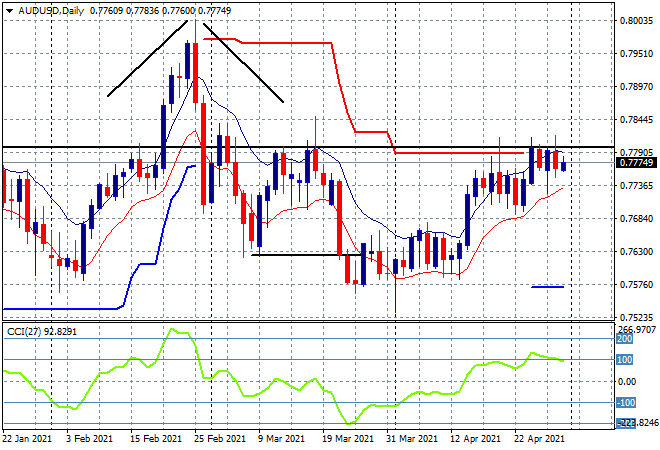
The Australian dollar sold off again overnight, now putting in a two week long triple top pattern as it continues to rebuff the 78 cent level versus USD. The daily chart below shows a classic bearish head and shoulders medium term pattern also forming with a potential rollover here that shorter term Pacific Peso bulls maybe confusing for a new trend:
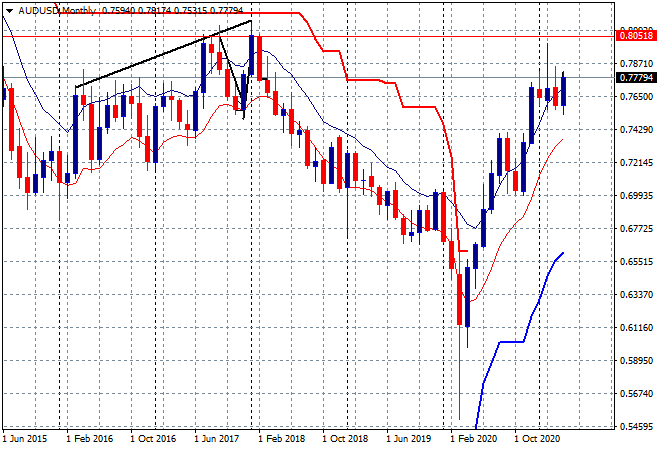
The monthly chart continues to show a staggering inflation since the COVID selloff, now settling in on multi year resistance at the 80 handle, with the 80.5 cent level from 2016/2017 proving the strongest barrier:
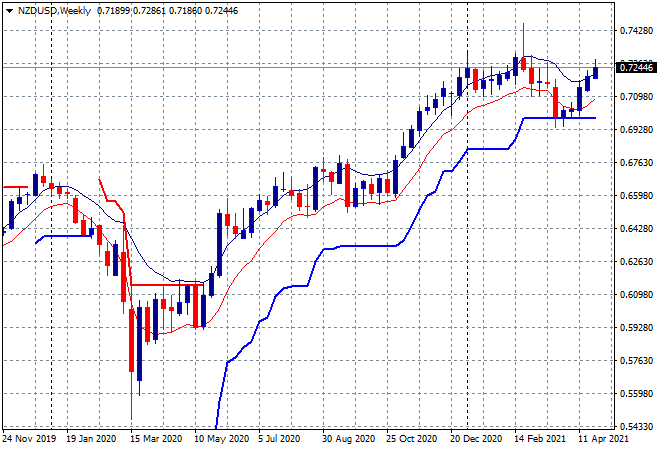
And it may all come down to the Kiwi as the NZ dollar continues to outpace the Aussie. The weekly chart shows a similar pattern to the Aussie with some strong resistance to overcome at the 74 cent level:
Something that is dividing the FX analysis community with Bank of America suggesting that the Kiwi is “currently the most vulnerable G10 currency with USD about to reverse higher” while Morgan Stanley is short AUD/NZD, with a “short-term…consolidation in US yields and higher risk asset prices should benefit NZD/USD, which tends to gain on average in periods of “risk-on”.
The longer term AUDNZD bears (sic) this out with a continuation of lower highs for the Aussie against its Kiwi brother despite the massive iron ore tailwind and low interest rates:
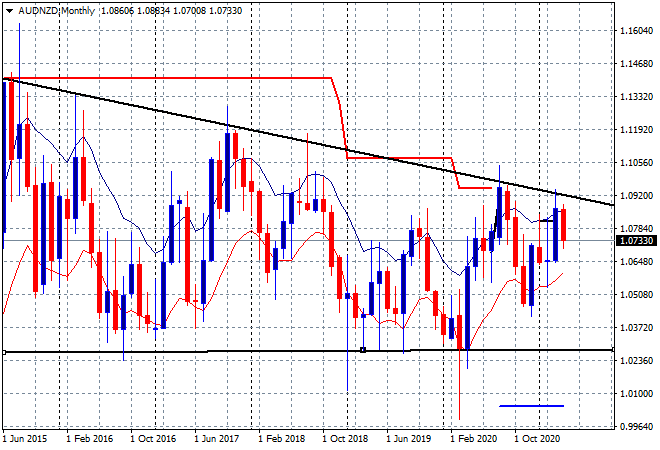
The tactical picture shows a high risk/reward short AUD/NZD and indeed short AUD/USD possibility going into next month.