
The Australian dollar enjoyed another strong night after yesterday’s solid data and overnight’s ongoing risk melt-up:
The Australian dollar is up and away again though well short of previous highs:
Oil and gold have made friends again:
Base metals metals flew:
Big miners too:
But EM stocks remain under pressure from Chinese tightening:
The to the night’s action was tumbling US bond yields:
Which launched risk frenzy:
Westpac has the data:
Event Wrap
The US imposed new sanctions on Russia, including restrictions on buying new sovereign debt, in retaliation for alleged misconduct including efforts to disrupt the US election. Ukraine warned Russia against troops crossing its border, citing a build-up, and appealed for Western support to avoid direct confrontation.
US retail sales in March beat estimates, surging 9.8%m/m and 8.2%m/m ex-food and energy (vs. est. +5.9%m/m and +6.4%m/m). The core control group slightly missed estimates, at 6.9%m/m (vs. est. 7.2%m/m, prior -3.4%m/m from initial -3.5%m/m).
Weekly initial jobless claims were lower than estimates at 576k (vs. est. 700k) while continuous claims were in line at 3.73m (est. 3.70m).
US regional Fed surveys were strong. The NY (Empire) Fed manufacturing survey rose to 26.3 (est. 20.0, prior 17.4) on strong new orders (26.9, prior 9.1), solid employment (number of employees 13.9, prior 9.4), and stronger prices (prices paid 74.7, prior 64.4). The Philadelphia Fed business survey rose to 50.2 (est. 41.5) – the highest since 1973.
Industrial production in March rose 1.4%m/m (est. +2.5%m/m), from a revised -2.6% in Feb. (initial release -2.2%m/m). Capacity Utilisation came in at 74.4% (est. 75.6%), from a revised 73.4% in Feb. (initially 73.8%). The smaller rebound from weather-affected February may have been distorted by lower power production as temperatures rose.
The NAHB housing index remained solid at 83 (as estimated, prior 82), consolidating the strong run in late 2020.
German final CPI for March was unchanged at 0.5%m/m and 1.7%y/y (gains were due to tax/policy changes). French and Italian final March CPI releases were similarly little changed.
Event Outlook
New Zealand: Ahead of the March update, the manufacturing PMI has been firming, but supply disruptions may be a drag.
China: China’s economy went from strength-to-strength in 2020, registering annual growth of 6.5%yr despite the ill effects of the pandemic in Q1, when annual growth fell to -6.8%yr. Annual GDP growth for the first half of 2021 will be flattered by base effects. Still, our forecast of a 19.1%yr gain in Q1 2021 will also be a circa 5% annualised gain quarter on quarter, fuelled by broad-based strength in investment as well as demand from the consumer. Industrial production (market f/c: 26.5%yr ytd), fixed asset investment (market f/c: 26%yr ytd) and retail sales (market f/c: 31.7%yr ytd) will all reveal that not only has China recouped its losses, but built a strong foundation for a long and robust new growth cycle.
US: Housing starts were disrupted by weather in February, but are set to rebound 13.4% in March. Meanwhile, building permits are set to advance 1.7%, already near a 15 year high. The April Uni. Of Michigan sentiment index will be supported by the relaxation of restrictions, stimulus, and the vaccine rollout (market f/c: 89.0).
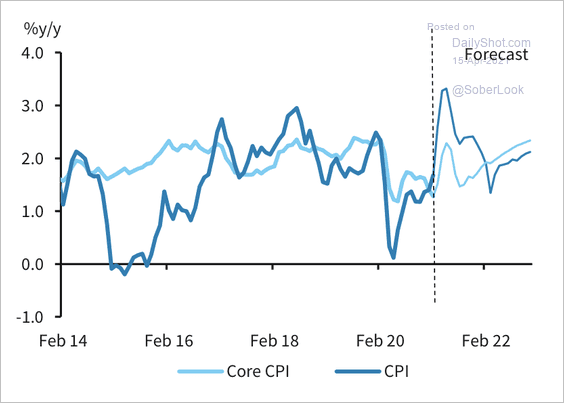
US data was very strong but yields still tumbled. There profile of futures inflation gives a short-term window for the market to go either way. Ahead it will spike then crash then grind higher:
I still think that this will lead to US yield outperformance over the stretch but it’s going to take time, via Credit Suisse:
US Equities continue their strong push higher and the S&P500 stays seen on course for our 4200 Q2 target. We are though now seeing a series of “redflags” go up as we head towards our target, adding weight to our base case view that we are close to a fresh consolidation/corrective phase, ideally from our4200 objective.
Key “red flags” for the S&P500 are as follows:
– The rally has extended to the top of its multi-year channel from the 2009 low
– We have moved to the upper end of its “typical” extreme – 15% above the200-day average
–On Balance Volume is not confirming the new highs and shows a clear bearish divergence
–Outright Volume is now falling as the market itself moves higher
–93% of S&P500 stocks are now above their 200-day average
–Weekly De Mark Sequential is now seen very close to an exhaustion signal
If we are indeed getting closer to a corrective phase, we believe US Small Caps may lead on the downside, with the rally having already stalled at the top of its long-term trend from the 2009 low, with a potential “head&shoulders” top seen forming.
Despite the red flags outlined above, we still feel the scope for US equity strength to extend at ouch further first though (towards 4200),with the Nasdaq 100 holding a“head&shoulders” base, which we expect to lead the index above 14000 to 14380…
…and with US Cyclicals still expected to extend their outperformance to Defensives for now.
Whilst the Volume picture is of concern, Breadth measures stay strong, suggesting weakness (if seen) is still likely to be corrective…
…and we believe volatility has moved to a new lower regime after the break of major support in the VIX, also suggesting corrections should be light in nature.
The fall in the USD has now extended back to the “neckline” to its recent base and we look for a floor here and for the USD to ideally start to strengthen again.
CS Global Risk Appetite stays seen on course for “euphoria”, which we still believe can be seen this month.
Global Bond Yields have shifted into very well defined ranges over the past few weeks, which we expect to persist over the coming weeks. Nevertheless, our base case is that the core yield up trends will eventually resume later in the year after this lengthier consolidation phase.
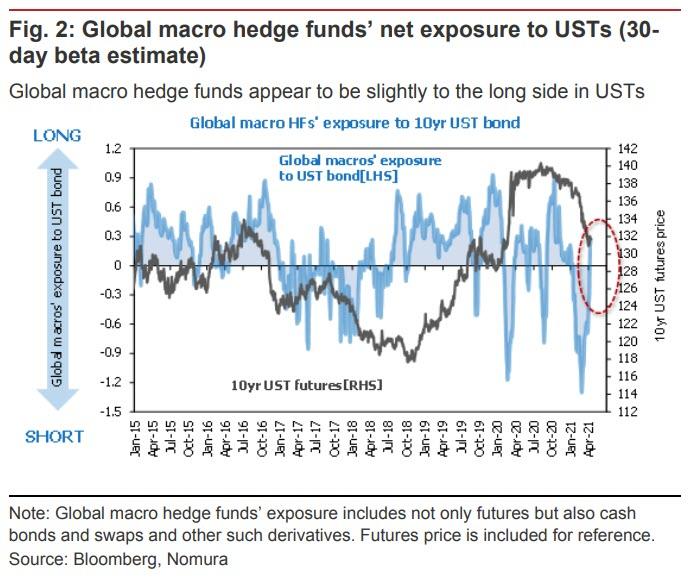
None of those corrective events are going to happen until yields begin rising again. I expect volatility on that front as inflation is pushed around and catch-up growth unleashed. For now, we are simply unwinding what became a pretty steep bond short by the robots, via Nomura:
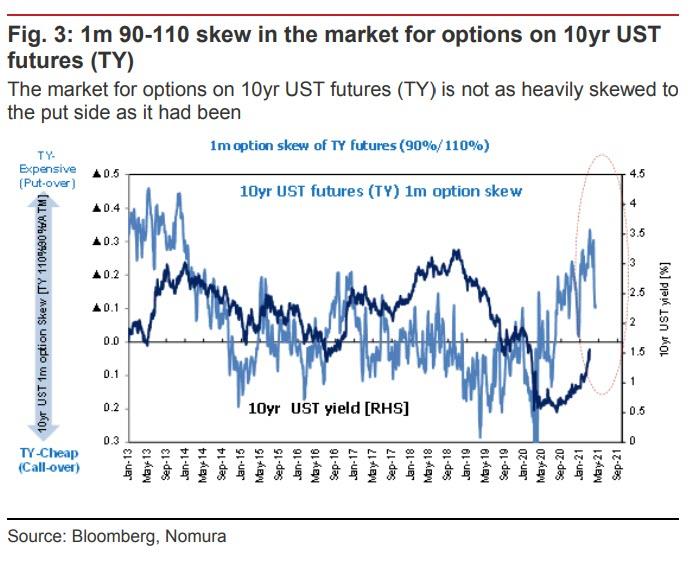
Options on 10yr UST futures (TY) had been significantly skewed to the put side, but this is no longer the case, and this change correlates to an extent with the flows generated by the course correction being executed by global macro hedge funds.
We estimate that technically oriented CTAs as well have been covering short TY positions. We estimate that the short positions accumulated by CTAs since January break even at a 10yr UST yield of around 1.47% on average, so with market yields where they currently stand, we think it makes sense to assume that CTAs are engaged in some preemptive profit-taking.

So, enjoy it all for now. I will continue to use every spike in the AUD to shift more assets offshore. The US is the engine for the coming cycle. China is the caboose.
To use a forex analogy, the Australian dollar is passing through 2011.
