
Wall Street was very quiet and risk averse overnight while European bourses continued the bullish trend from the Asian session as US traders await tomorrow’s FOMC meeting. The bond market was equally quiet with 10 year Treasury yields range trading around the 1.5 to 1.6% level, while the USD firmed mainly against Euro and Pound Sterling. Commodities continued to pullback with both oil markers dropping over 1% alongside copper with a 2% drop as gold was little changed.
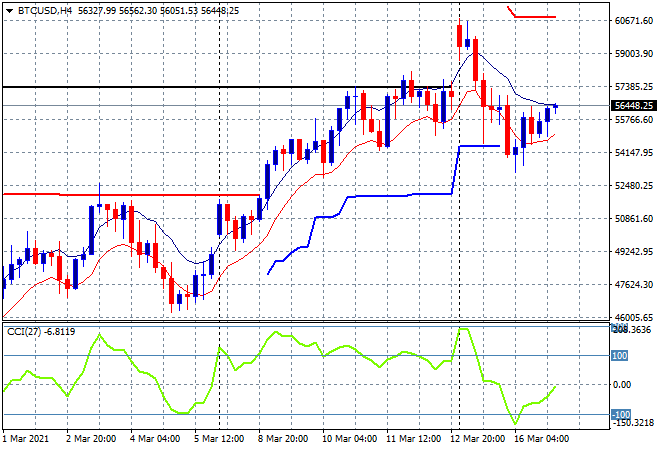
Bitcoin had another fantastic 25 (sic) hours of volatility with a big decline through to trailing ATR support on the four hourly chart at the $54K level before coming back in the European sessions to just over the $56K level. This could be setting up for a beautiful head and shoulders pattern with the neckline at the $57K level:
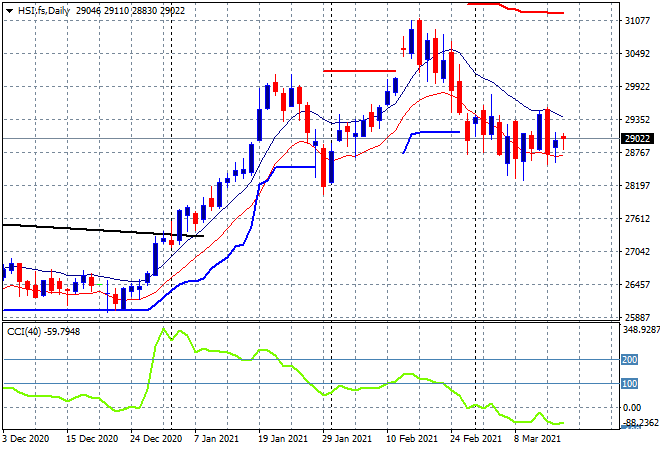
Looking at share markets in Asia from yesterday’s session where the Shanghai Composite had a solid session, closing 0.6% higher at 3446 points while the Hang Seng Index is doing the same, finishing 0.7% higher at 29026 points. The daily chart previously showed a bearish engulfing candle pattern from Friday’s session which is still dominating, so price must push significantly higher in the next few sessions or we could see a possible breach of support at the previous daily lows at the 28300 point level:
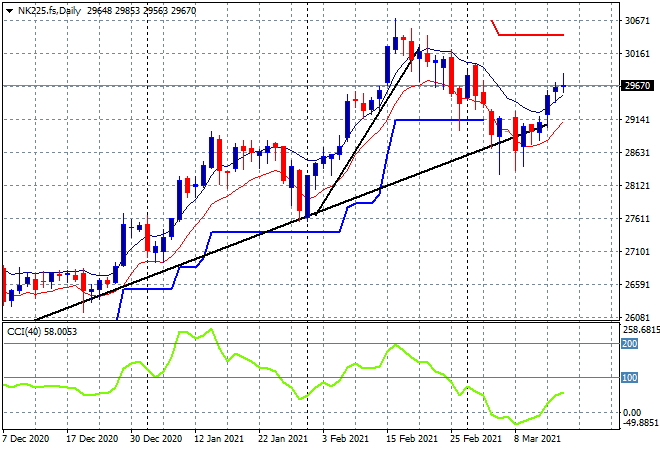
Japanese markets put in similar results, with the Nikkei 225 closing 0.5% higher to 29921 points. The daily chart is still showing price building back above the trendline from the December lows with a continued advance over the previous ATR trailing support level at 29000 helping momentum push higher. Can price however return back above 30000 points or is still a stall phase:
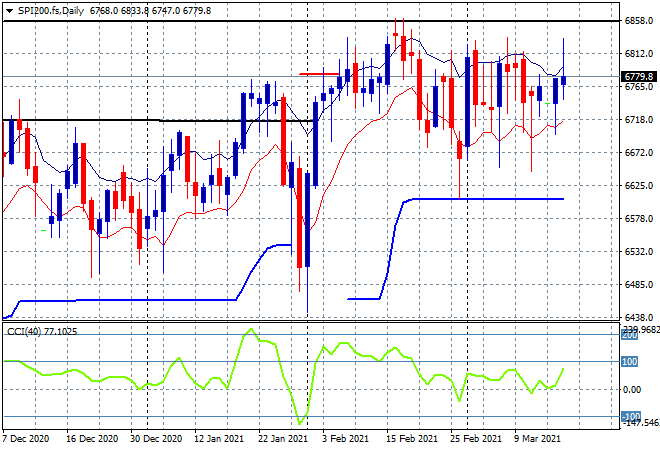
The ASX200 was able to put on the best gains in the region, finishing 0.8% higher at 6827 points. SPI futures however are indicating a poorer start this morning, down over 30 points so we’re likely to see a reversion back below the 6800 point level:
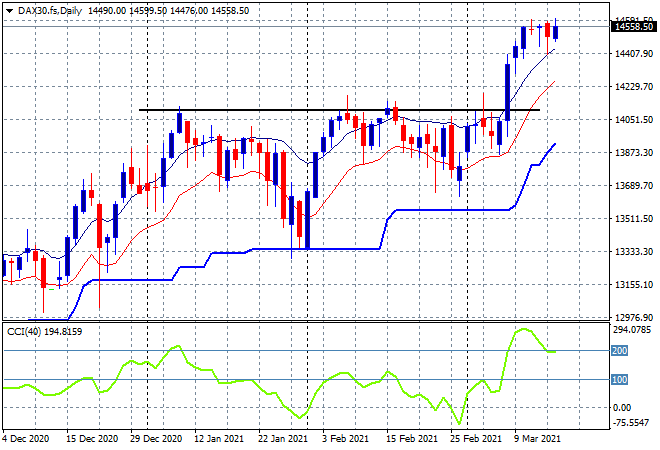
European markets came back with more confidence after a previous lacklustre session with the German DAX lifting 0.6% to 14557 points, extending gains again above previous resistance at the 14000 point level. Momentum readings remain way overbought with price finding some local resistance at the 14500 point level, so watch the high moving average at 14400 or so for signs of a rollover:
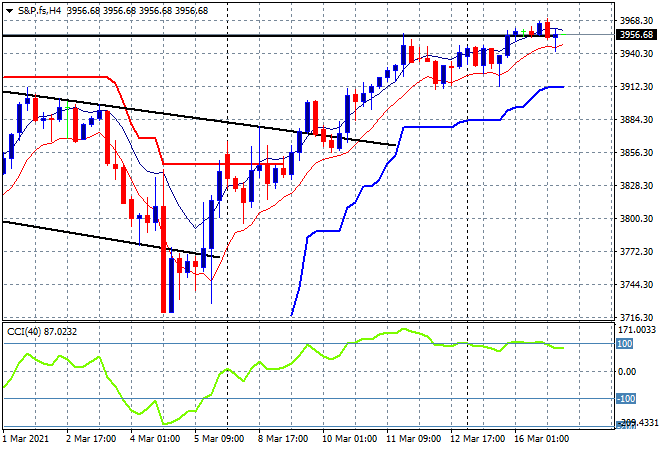
Wall Street however was listless again with no final hour reprieve across the three major bourses, with the NASDAQ the only one to put on gains, up 0.1% while the S&P500 finished 0.2% lower, pulling back from its recent record highs to close at 3962 points. The four hourly chart shows price wanting to push through the previous February high, filling this reflation rally to completion and get going to the 4000 point level, but resistance is slowly building here:
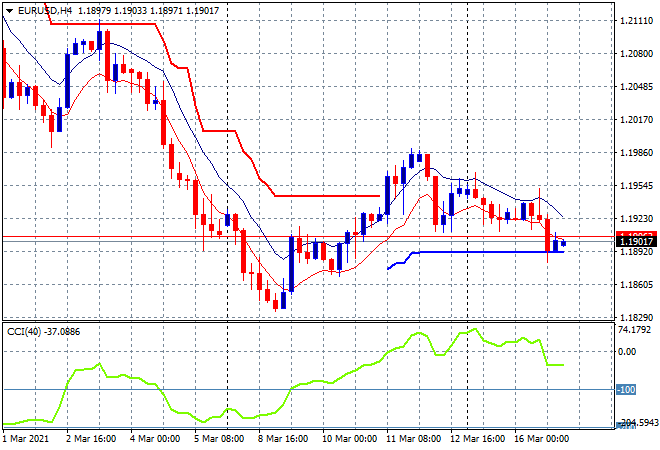
Currency markets remain in oscillation mode with low volatility outside Europe with Euro continuing its retracement overnight, settling on the 1.19 handle this morning. The decline from last week’s late high is continuing here, with four hourly momentum flopping to the downside but ATR support not yet broken, but there’s a definite lack of buyers here:
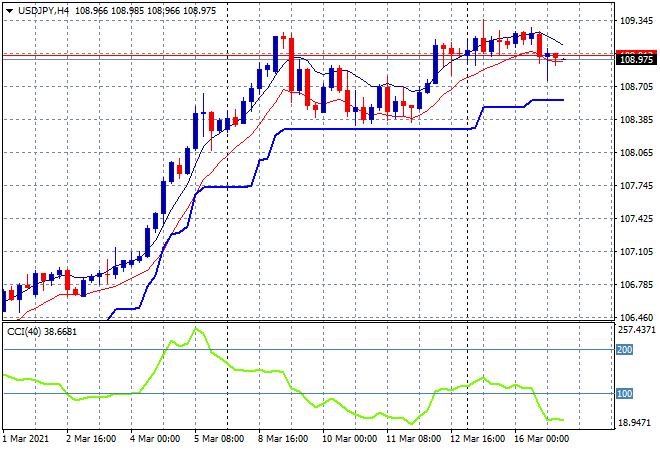
The USDJPY pair went nowhere again overnight, with a small dip below the 109 handle and still unable to beat last week’s high at the 109.20 level, settling below instead. As I said previously, this pattern could either be the start of another epic upleg in USD strength against Yen or a double top pattern presaging falls below the 108.30 level, so watch for any further downside below the 108.70 for signs of the latter:
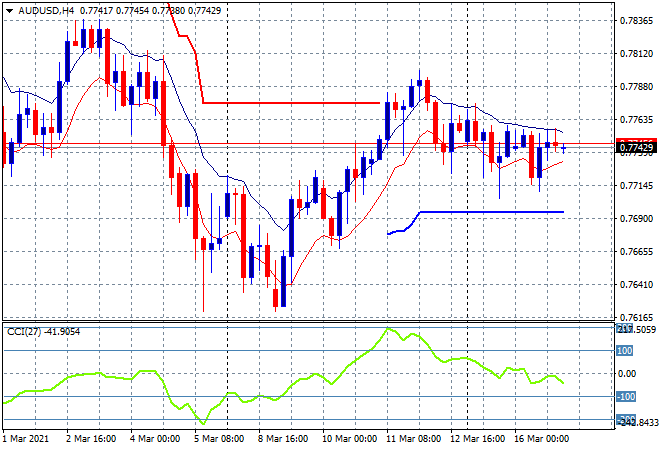
The Australian dollar was again somewhat volatile but range trading as this risk currency awaits the next Fed meeting and ignores other catalysts. Note how price has been unable to break above the high moving average so far this week as momentum crosses over into negative territory as commodity prices are falling across the complex:
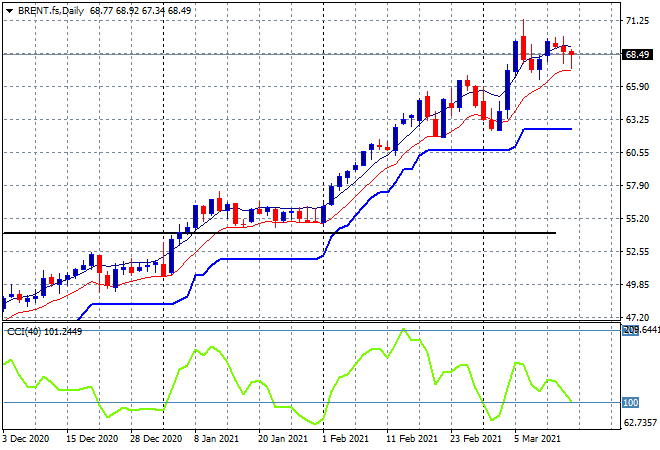
Oil prices pulled back again last night, but are still at post-COVID record highs with Brent crude slipping below the $69USD per barrel level. The 2019 highs at the $74 level still look good as the next upside target with momentum nicely overbought, but watch the low moving average on the daily chart for signs of lack of buying support for this next move:
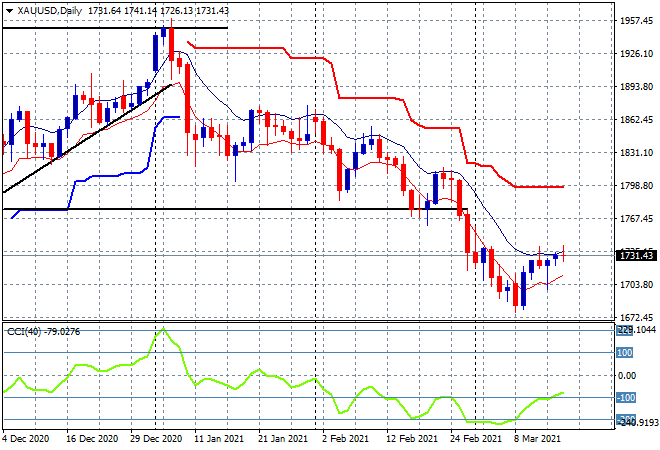
Gold is still trying to bounceback and managed to hold on to just above the $1730USD per ounce level in what could be a potential bottoming action. I still consider this a short term short covering move up that could take the shiny metal back up to former support, but very strong resistance at the $1770 level, with the longer term chart signalling the next downside target at the 2019 pre-breakout highs around $1500:
Glossary of Acronyms and Technical Analysis Terms:
ATR: Average True Range – measures the degree of price volatility averaged over a time period
ATR Support/Resistance: a ratcheting mechanism that follows price below/above a trend, that if breached shows above average volatility
CCI: Commodity Channel Index: a momentum reading that calculates current price away from the statistical mean or “typical” price to indicate overbought (far above the mean) or oversold (far below the mean)
Low/High Moving Average: rolling mean of prices in this case, the low and high for the day/hour which creates a band around the actual price movement
FOMC: Federal Open Market Committee, monthly meeting of Federal Reserve regarding monetary policy (setting interest rates)
DOE: US Department of Energy
Uncle Point: or stop loss point, a level at which you’ve clearly been wrong on your position, so cry uncle and get out!