
Share markets are have a tepid start to the trading week, although a late surge on Wall Street this morning could provide a bit more fire for Asian equities to get moving on the open. European markets retreated even as bond yields pulled back a little, while the USD range traded against the majors but remains at a nine month high against Yen which should help Japanese stocks. Commodities fell back with both oil markers dropping nearly 1% alongside copper while iron ore continued its pullback and gold was little changed.
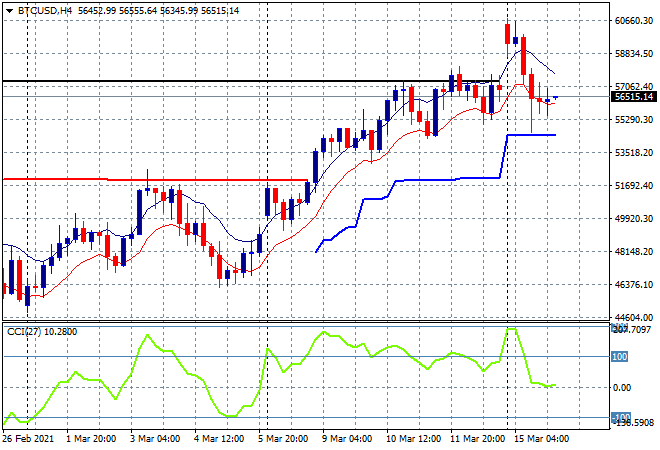
Bitcoin burst through the $60K level to a new historic high before completely retracing this move overnight in a very volatile – aka normal – twenty four hour period. Will it try again later today – watch the high moving average line at the $57K level closely but also ATR support on the four hourly chart at the $54K level for signs of a further retracement:
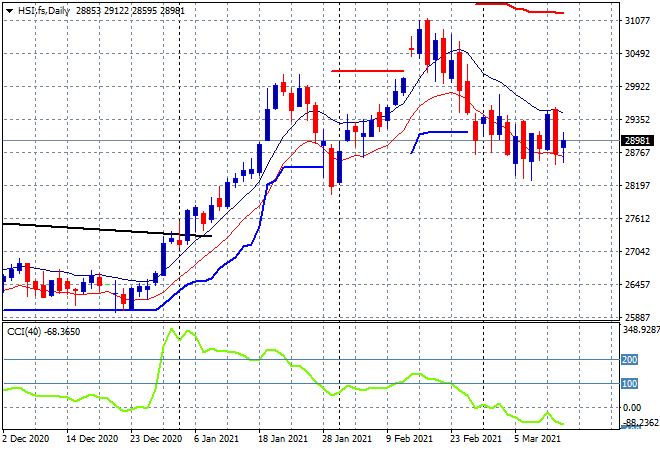
Looking at share markets in Asia from yesterday’s session where the Shanghai Composite finished 1% lower at 3419 points while the Hang Seng Index was looking to put in a scratch session but managed to finish 0.3% higher at 28833 points. The daily chart showed a bearish engulfing candle pattern from Friday’s session which is still dominating here so we should see price push lower with negative daily momentum pointing to an possible breach of support at the previous daily lows at the 28300 point level:
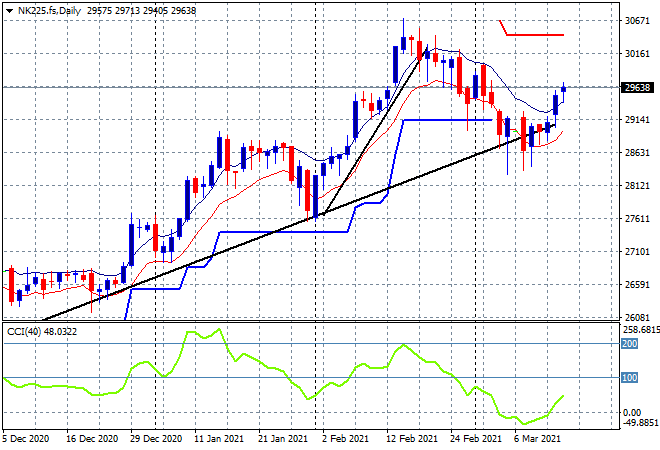
Japanese markets were also somewhat stuck with the Nikkei 225 closing 0.2% higher at 29737 points but still remaining back on its months long uptrend. The daily chart showed a clear break back above the trendline from the December lows with further advance over the previous ATR trailing support level at 29000 helping momentum push higher so expect an attempt to return above 30000 points this week:
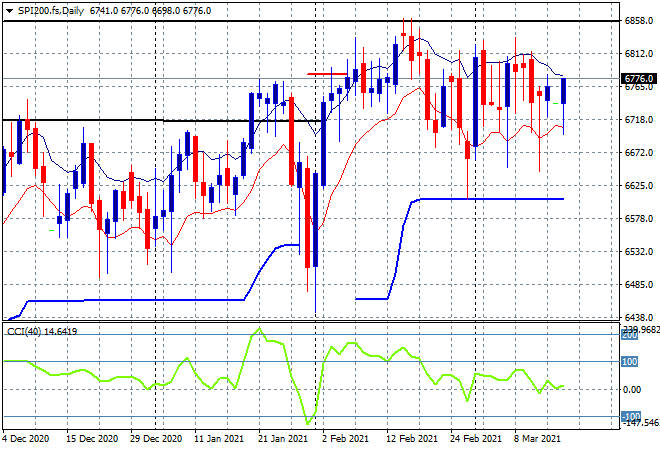
The ASX200 was largely unchanged, finishing 0.1% higher at 6773 points with SPI futures indicating a better start this morning, up nearly 30 points or 0.4% on the back of the late Wall Street rally. The daily chart is looking messy still but there is firming support here below 6700 points so watch for a break above the 6800 point level:
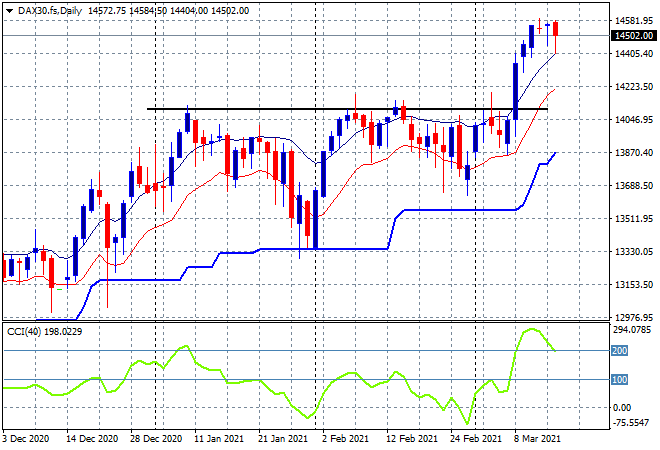
European markets came back slightly, possibly on the AV vaccine news but also on lack of any further catalysts with the German DAX retracing 0.3% to 14461 points, but still well above previous resistance at the 14000 point level. This is not unexpected as previous momentum readings were off the charts so taking some more heat come out of the market is welcome with the high moving average on the daily chart at the 14400 point level firming as short term support, ready for another break higher:
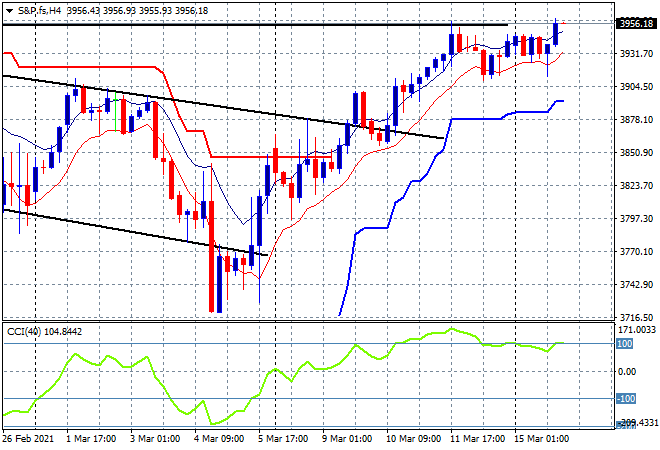
Wall Street was listless until the final hours of the trading session that saw the NASDAQ find some life, closing 1% higher while the S&P500 finished 0.6% higher to a new record high at 3968 points. The four hourly chart shows price pushing through the previous February high, filling this reflation rally to completion with the 4000 point level the next target:
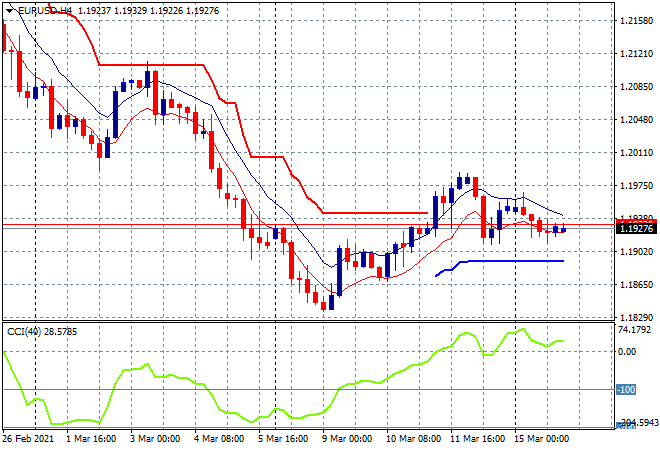
Currency markets remain in oscillation mode with roundtrips and low volatility giving traders no activity (or profit!) overnight with Euro retracing slightly from the mid 1.19s to 1.1920 this morning. As I said yesterday, it still needs a proper bullish breakout above trailing ATR resistance at the mid 1.19 level before calling this weekly decline over with four hourly momentum looking a lot better there is the potential to rise up to previous support around the 1.2050 level:
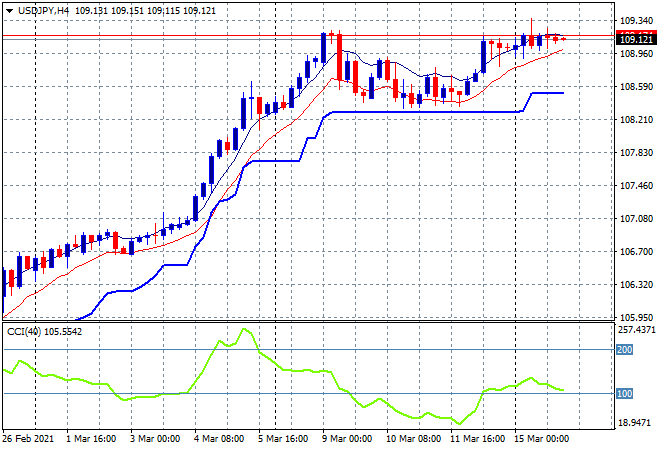
The USDJPY pair also seemingly went nowhere overnight, still unable to beat last week’s high at the 109.20 level, setting just above the 109.10 level instead. This could either be the start of another epic upleg in USD strength against Yen or a double top pattern presaging falls below the 108.30 level:
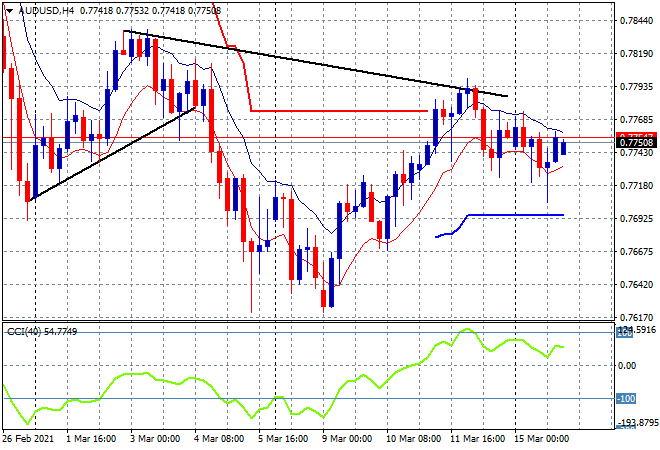
The Australian dollar was a little more fruity, but eventually finished where it started on Monday morning at the mid 77 level with a dip below the 77 handle filled later in the session. Its still not out of its funk, required a sustained breakout above trailing ATR resistance at the 77.80 level which has been rebuffed so far, so I’m watching again for another attempt, but where is the catalyst going to come from as commodity prices go into a holding pattern:
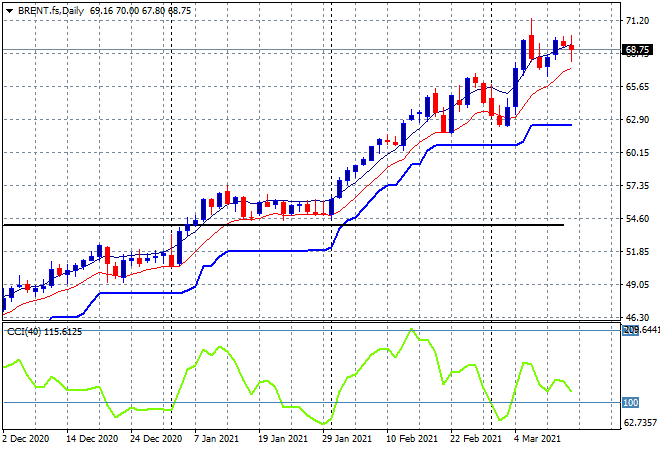
Oil prices pulled back slightly last night, but are still at post-COVID record highs with Brent crude slipping slightly below the $69USD per barrel level. The 2019 highs at the $74 level still look good as the next upside target with momentum nicely overbought, but watch the low moving average on the daily chart for signs of lack of buying support for this next move:
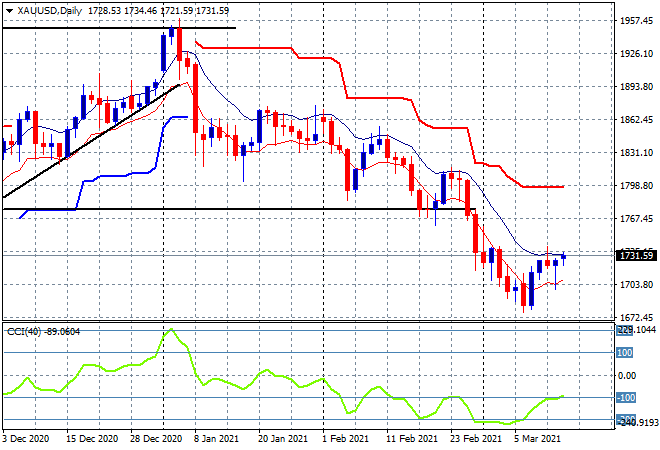
Gold is trying again to bounceback and managed another small move higher to just above the $1730USD per ounce level in what could be a potential bottoming action. I still consider this a short term short covering move up that could take the shiny metal back up to former support, but very strong resistance at the $1770 level, with the longer term chart signalling the next downside target at the 2019 pre-breakout highs around $1500:
Glossary of Acronyms and Technical Analysis Terms:
ATR: Average True Range – measures the degree of price volatility averaged over a time period
ATR Support/Resistance: a ratcheting mechanism that follows price below/above a trend, that if breached shows above average volatility
CCI: Commodity Channel Index: a momentum reading that calculates current price away from the statistical mean or “typical” price to indicate overbought (far above the mean) or oversold (far below the mean)
Low/High Moving Average: rolling mean of prices in this case, the low and high for the day/hour which creates a band around the actual price movement
FOMC: Federal Open Market Committee, monthly meeting of Federal Reserve regarding monetary policy (setting interest rates)
DOE: US Department of Energy
Uncle Point: or stop loss point, a level at which you’ve clearly been wrong on your position, so cry uncle and get out!