
Friday night saw the release of US PPI inflation and European industrial production numbers, both meeting expectations but resulting in currencies round tripping with tepid finishes to the trading week on most equity markets, as the NASDAQ slumped in the wake of higher bond yields. Both Treasury and European sovereign bond yields spiked higher again on Friday night which may provide a headwind for Asian equities here on the open, while commodities were little changed as oil remains highly bullish, iron ore had a slumping session which could drag ASX equities lower.
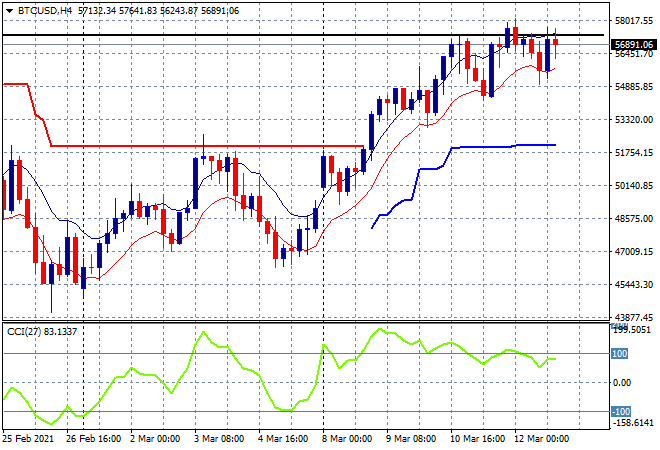
Bitcoin continues to inch further towards the $60K level with price once again hitting the previous daily high on Friday night (solid black horizontal line was the previous high) as it gets ready to burst through following the weekend gap:
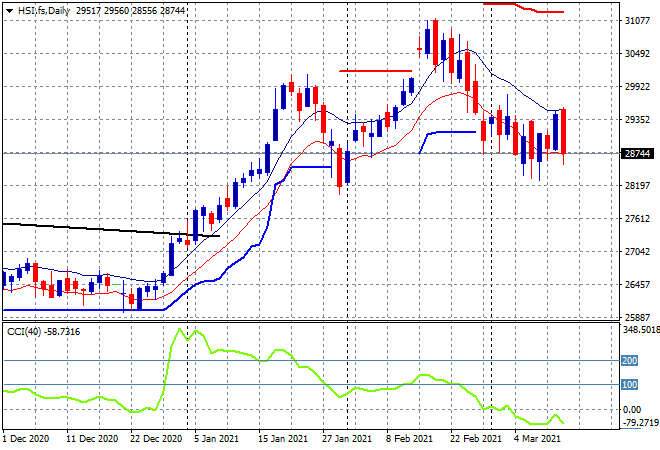
Looking at share markets in Asia from Friday’s session where the Shanghai Composite was able to finish the week with a solid result, up 0.5% to 3453 points after a dreadful start while the Hang Seng Index was unable to climb above its once-off bounce and fell over 2% to close at 28739 points. The daily chart shows a clear bearish engulfing candle pattern from Friday’s session which means it will continue to track lower with negative daily momentum pointing to an inflection below the previous daily lows at the 28300 point level:
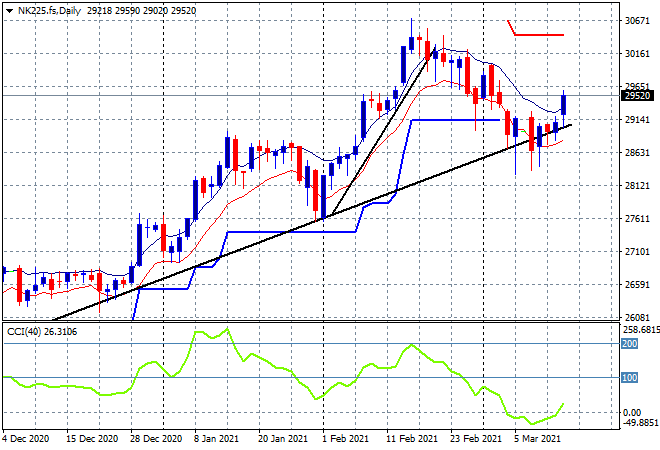
Japanese markets on the other hand were much more bullish than expected with the Nikkei 225 closing 1.7% higher at 29717 points as it firmly gets back on its months long uptrend. The daily chart shows a clear break back above the trendline from the December lows and also previous ATR trailing support level at 29000 remains key, with momentum also switching back to positive here so expect an attempt to return above 30000 points this week:
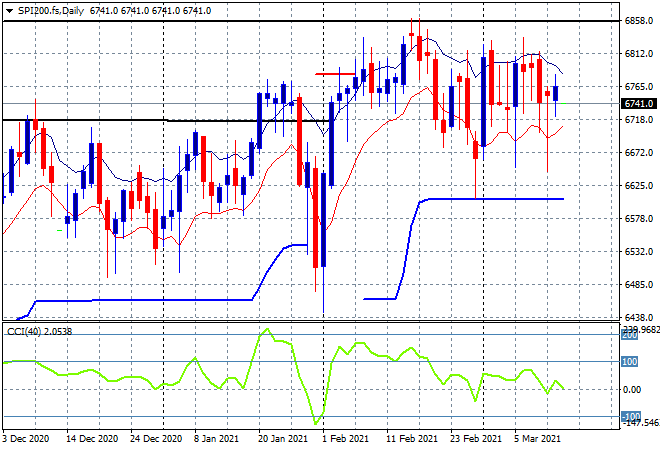
The ASX200 was able to find some lost confidence on Friday, finishing 0.7% higher at 6766 points with SPI futures indicating a slightly shaky start to the trading week. This makes sense given the daily chart remains in a very messy mode here as the market again tries to push through heavy resistance at or around the 6900 point level but traction is hard to find:
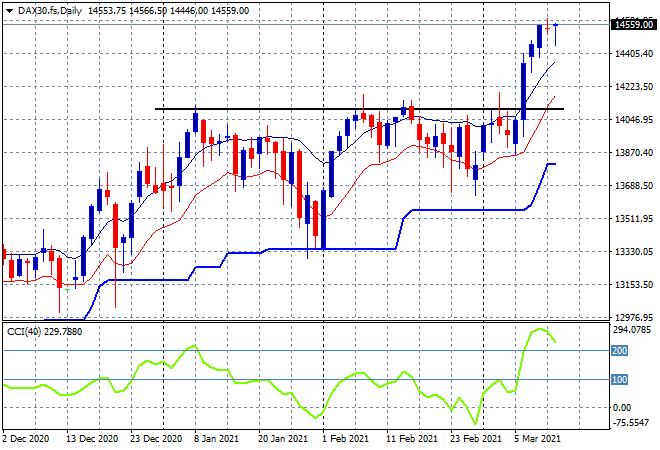
European markets remained somewhat bullish across the continent, although there were some mixed results despite very good industrial production figures coming out on Friday night, following the previous session ECB non-moves. The German DAX actually fell back nearly 0.5% but is still well above previous resistance at the 14000 point level, closing the week with a new high at 14502 points. Momentum remains off the charts as this move becomes less sustainable we could see some more heat come out of the market as the trading week begins, but it depends more on risk correlation with Wall Street and a higher Euro:
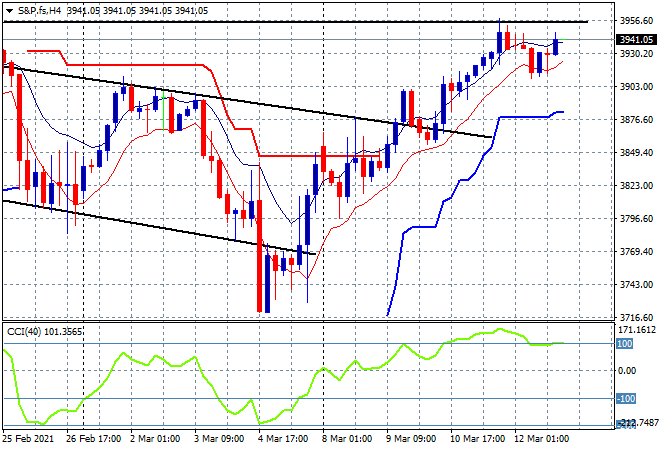
Wall Street was again in a mixed funk with the headline Dow lifting nearly 1% while the NASDAQ slumped again, falling back 0.6% while the S&P500 basically finished with a scratch session, one point higher at 3943 points. The four hourly chart shows the bounce off the lower trend channel has failed to break through the previous highs (upper horizontal black line) with the fiscal and monetary stimulus one-two punch not yet enough to get it over the line, but this is far from a bearish picture:
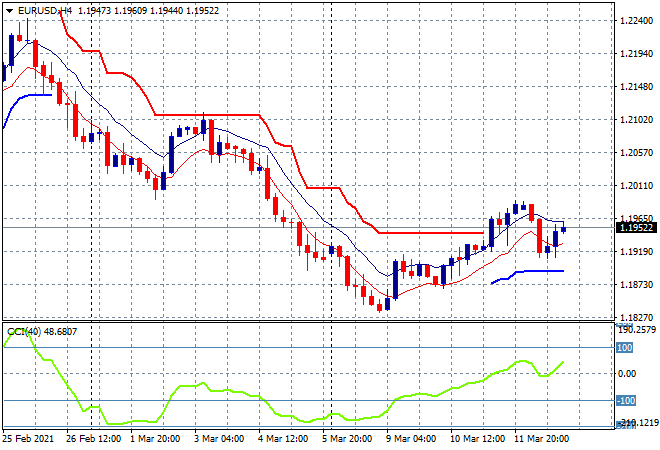
Currency markets are in oscillation mode with roundtrips the order of the session on Friday night, switching from strong to weak USD mode across the majors as economic reports came in. The Euro lifted again almost through the 1.20 handle on the firmer than expected industrial production print but then come back to the 1.19 lows before settling at the mid 1.19s. We still need a proper bullish breakout above trailing ATR resistance at the mid 1.19 level before calling this weekly decline over with four hourly momentum looking a lot better there is the potential to rise up to previous support around the 1.2050 level:
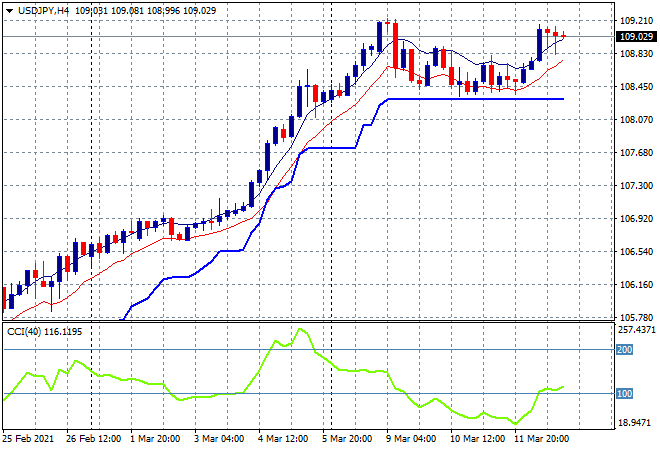
The USDJPY pair finished its own mild pullback, and then burst higher on Friday night but failed to beat the start of week intrasession high at the 109.20 level, setting just above the 109 handle proper. This could either be the start of another epic upleg in USD strength against Yen or a double top pattern presaging falls below the 108.30 level:
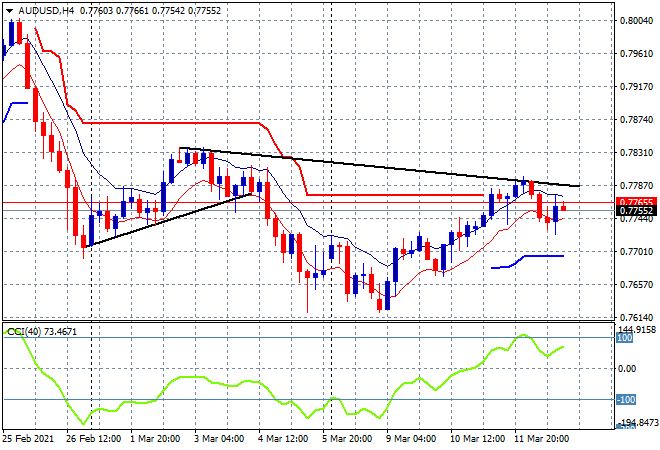
The Australian dollar tried to breakthrough the 78 handle but also roundtripped back towards the mid 77 level but in a larger view has done well this week to get out of its funk, almost hitting the 76 cent lows. Last week I said that a sustained breakout would require at a minimum a move above trailing ATR resistance at the 77.80 level which has been rebuffed so I’m watching again for another attempt, but where is the catalyst going to come from as commodity prices go into a holding pattern:
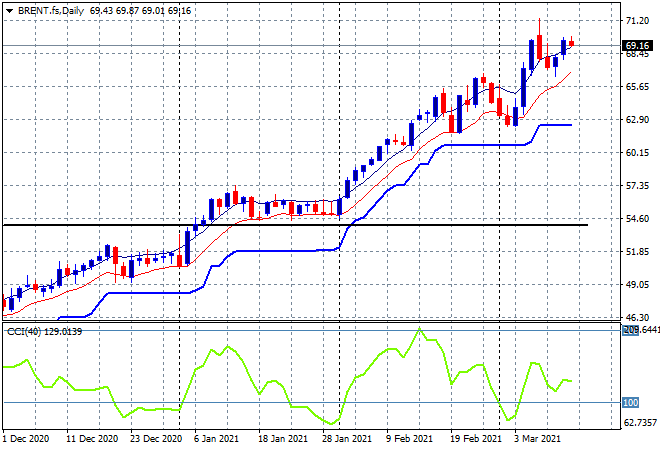
Oil prices wavered slightly on Friday night, but are near enough to their previous post-COVID record highs to not matter, with Brent crude remaining slightly above the $69USD per barrel level. The 2019 highs at the $74 level still look good as the next upside target with momentum nicely overbought:
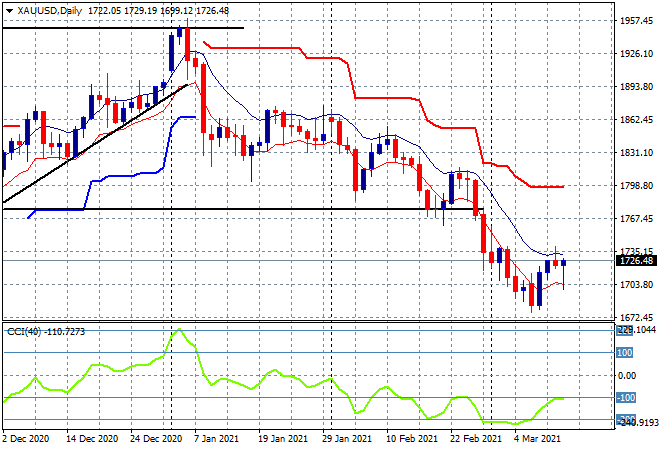
Gold tried to bounceback like other undollars on Friday night and managed a small move higher that equated to its mid week breakout at just above the $1720USD per ounce level. I still consider this a short term short covering move up to former support, now strong resistance at the $1770 level, with the longer term chart signalling the next downside target at the 2019 pre-breakout highs around $1500:
Glossary of Acronyms and Technical Analysis Terms:
ATR: Average True Range – measures the degree of price volatility averaged over a time period
ATR Support/Resistance: a ratcheting mechanism that follows price below/above a trend, that if breached shows above average volatility
CCI: Commodity Channel Index: a momentum reading that calculates current price away from the statistical mean or “typical” price to indicate overbought (far above the mean) or oversold (far below the mean)
Low/High Moving Average: rolling mean of prices in this case, the low and high for the day/hour which creates a band around the actual price movement
FOMC: Federal Open Market Committee, monthly meeting of Federal Reserve regarding monetary policy (setting interest rates)
DOE: US Department of Energy
Uncle Point: or stop loss point, a level at which you’ve clearly been wrong on your position, so cry uncle and get out!