
Friday night saw the release of the monthly US jobs figures – aka nonfarm payrolls – that sets the tone for risk sentiment for the rest of the month. A stonking result with a revised upward previous figure sent Wall Street higher and out of its funk with a near 2% gain across the board. Ten year Treasury yields popped through the 1.6% level but were able to retrace this move back to the low 1.5% following the NFP, but the USD continues to dominate against all of the major currencies, Euro particularly. OPEC’s restriction on oil production continues to push oil up to a new yearly high while gold remains depressed at the $1700USD per ounce level.
It should be a more confident start for Asian stocks today to start the trading week.
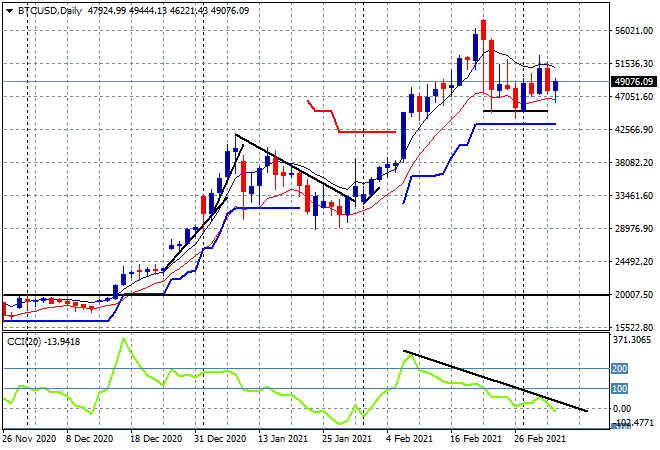
Bitcoin is stabilitsing along a point of control around the $50K level with a roundtrip on Friday night seeing it come back to just over the $49K without making a new daily low. The daily chart is defintiely firming here but we need to see a new daily high and/or break above the high moving average soon to get things going, with daily support still a long way off at the $42K level:
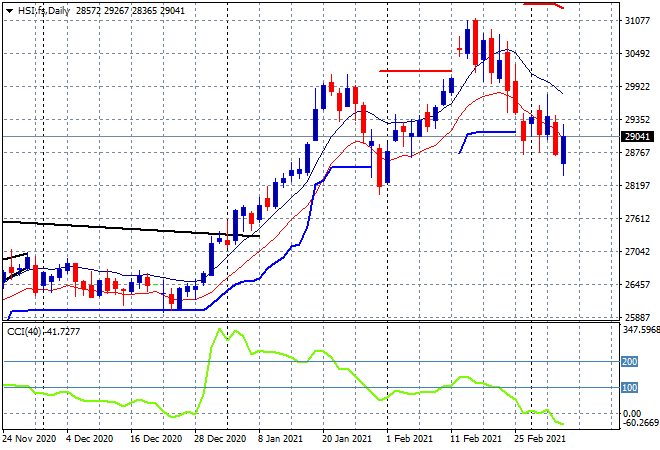
Looking at share markets in Asia from Friday’s session where the Shanghai Composite was down by nearly 1% earlier in the session, but managed to turn it around into a scratch session to finish at 3502 points while the Hang Seng Index stumbled, finishing 0.5% lower at 29098 points. The daily chart is still tracking lower with this series of new daily lows and still negative daily momentum pointing to a possible return to the January lows at just above 28000 points, although the machinations on Wall Street could abate this temporarily:
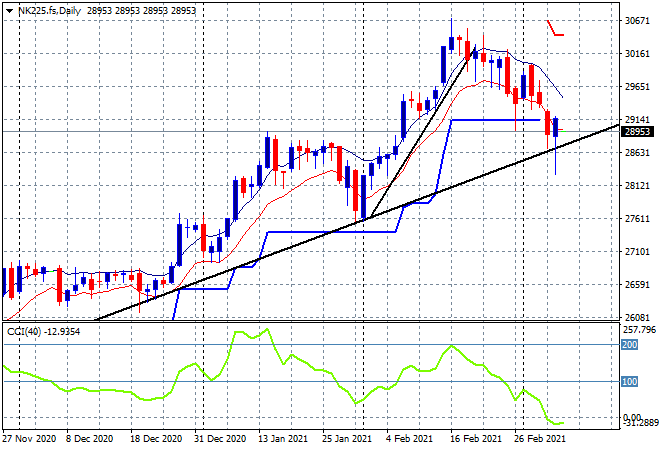
Japanese markets were also falling more sharply with the Nikkei 225 down nearly 0.8% before finishing only 0.2% lower at 28864 points. Futures are pointing to a better start this morning as price failed to breakthrough the trendline despite negative daily momentum readings that long tail below on Friday’s price indicates a bounce is about to occur:
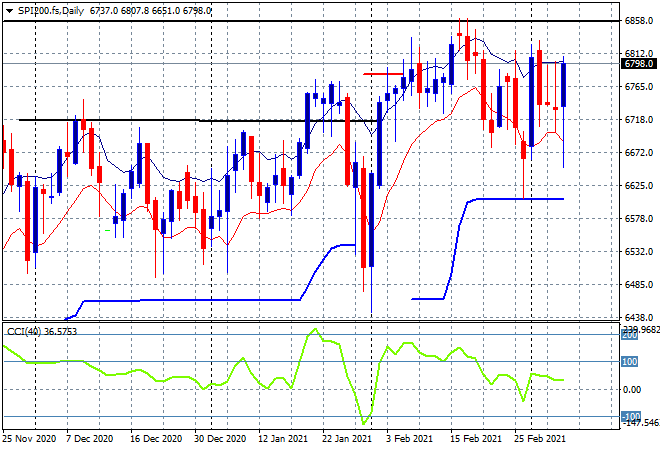
The ASX200 was keeping pace with the selloff, losing 0.7% again to finish right above 6700 points. Not that this matters since SPI futures are up a stonking 100 points or over 1.7% so this will get the market started fast this week! The daily chart remains messy but there is a firm build here as we again try to push through heavy resistance again at or around the 6900 point level:
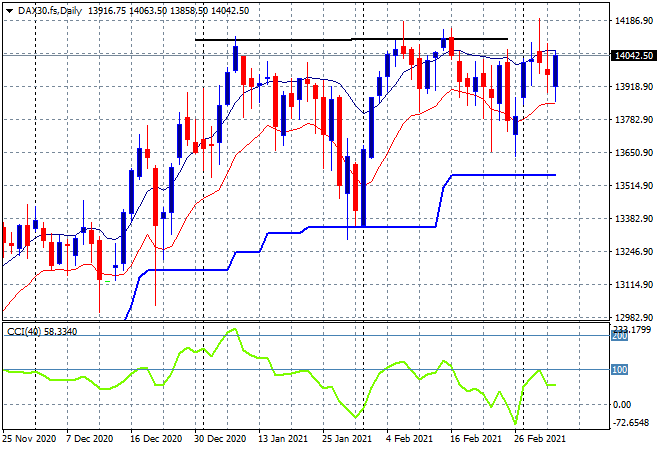
European markets were unable to bring it back during their own sessions, with mild losses across the continent. The German DAX stood out with a near 1% retracement but was able to bring most of this back in post close futures to probably start above the 14000 point barrier later tonight. The daily chart shows the market wanting to clear resistance here but still failing since Christmas last year, and even now with a vastly lower Euro, it really needs to punch through or confidence will evaporate:
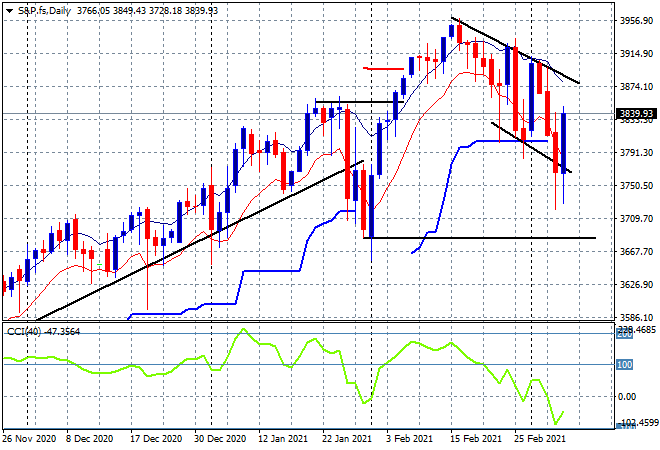
Wall Street’s fortunes turned around on Friday night with the NFP print pushing a sinking boat higher, even if temporarily. The NASDAQ bubble found a gasp of air and lifted 1.5% while the S&P500 bounced nearly 2% to finish at the 3841 point level. The daily chart shows a bounce off the lower trend channel and back above tentative daily support at the 3800 point level but momentum is still reading negative and its nowhere near out of the woods yet:
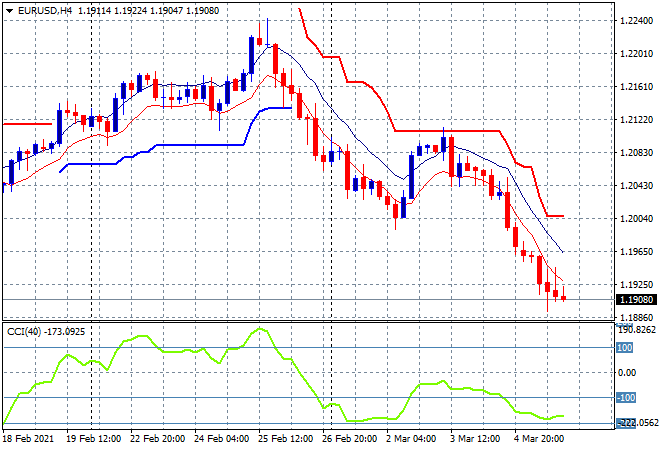
Currency markets remain volatile in the wake of a very strong USD and increasingly weaker sovereign bond markets. The Euro fell again on Friday, crashing through the 1.20 handle and settling right on the 1.19 level in what looks like yet another overdone move that could translate into more downside this week:
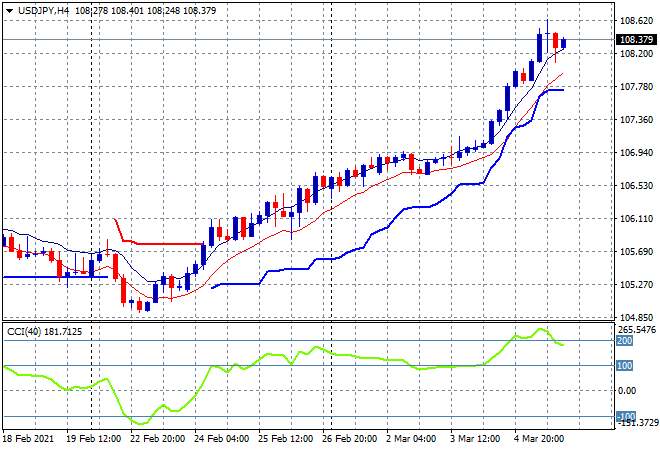
Conversely, the USDJPY pair is still shooting for the moon, heading through the 108 handle in a continued breakout and should provide a good tailwind for Japanese stocks, as the equates to the mid 2020 high. I still warn that price action and momentum is way overdone and ripe for a minor at least pullback, with some short term resistance building at the 108.50 level – but this could keep going on:
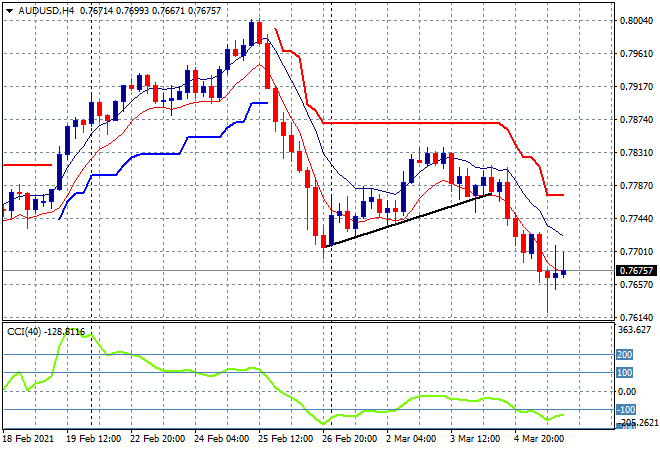
The Australian dollar fell back as well but was able to find some support at the 76.50 mid level on Friday night after failing mid week. This still keeps it well above the previous weekly lows but even higher commodity prices cannot help this currency at the moment:
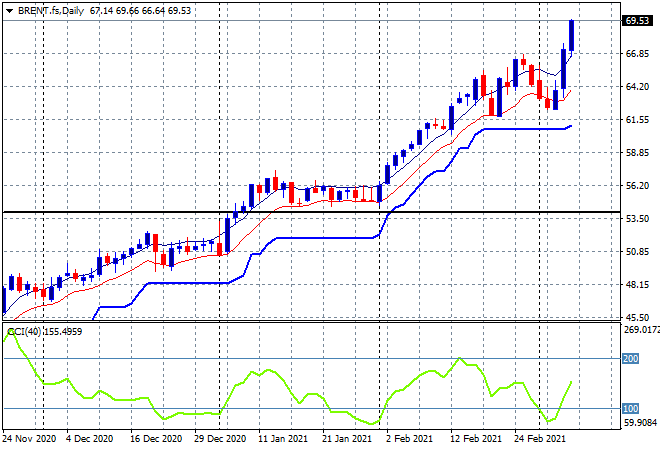
Oil prices shot higher again on Friday night due to the really good jobs figures and still on the back of the OPEC production cuts with Brent crude almost hitting the $70USD per barrel level and finalising my target here all along. What’s next for the sweet black tea? The 2019 highs at the $74 level look good:
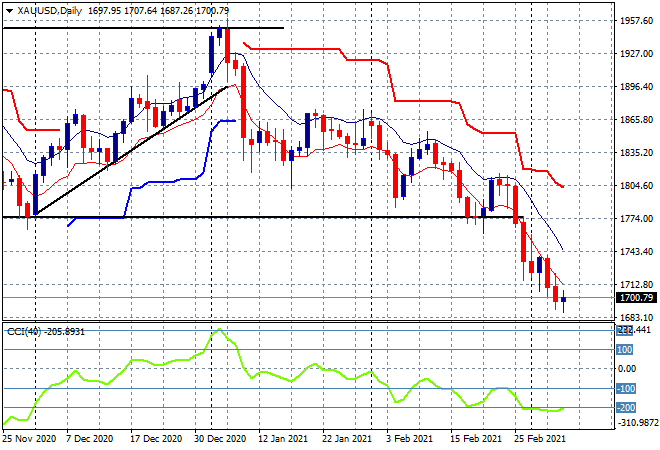
Gold fell back slightly to remain barely above the $1700USD per ounce level as it maintains it new monthly lows. While momentum remains considerably oversold there is no upside potential here save a very short term short covering move, with the longer term chart is more illustrative of where this can go (aka the 2019 pre-breakout highs around $1500):
Glossary of Acronyms and Technical Analysis Terms:
ATR: Average True Range – measures the degree of price volatility averaged over a time period
ATR Support/Resistance: a ratcheting mechanism that follows price below/above a trend, that if breached shows above average volatility
CCI: Commodity Channel Index: a momentum reading that calculates current price away from the statistical mean or “typical” price to indicate overbought (far above the mean) or oversold (far below the mean)
Low/High Moving Average: rolling mean of prices in this case, the low and high for the day/hour which creates a band around the actual price movement
FOMC: Federal Open Market Committee, monthly meeting of Federal Reserve regarding monetary policy (setting interest rates)
DOE: US Department of Energy
Uncle Point: or stop loss point, a level at which you’ve clearly been wrong on your position, so cry uncle and get out!