
Shares have bounced back from their volatile end of week shock following the bond market implosion, but the same can’t be said for currencies or indeed bonds, with Treasury yields lifting again overnight. Very strong US economic data is keeping the USD high, with the latest ISM manufacturing report the best in four years while German inflation is picking up, sending contrary signals to risk markets via central banks. Commodities fell across the board, although it was quite modest, with oil off by nearly 1% while copper and other industrials also stepped back a little, gold remains depressed falling another 0.6% to a new monthly low.
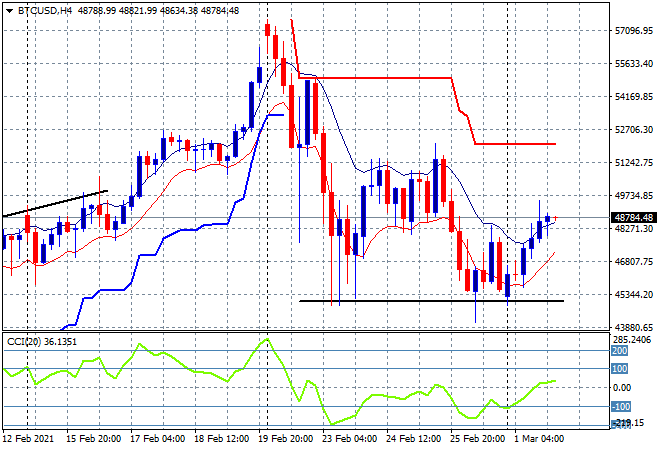
Bitcoin volatility remains relatively low with a small uptick through the $48K level after returning to the $45K level on Friday night, but this is still setting up for a major breakdown this week if confidence is blown over and it fails to beat the midweek highs of last week at the $51K level soon:
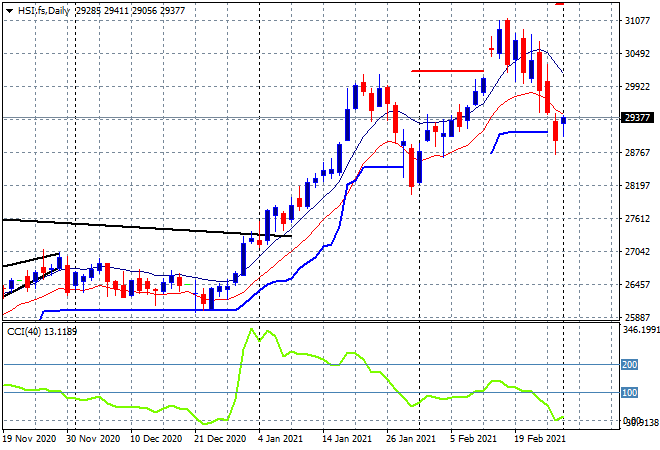
Looking at share markets in Asia from yesterday’s session where the Shanghai Composite finished just over 1.5% higher at 3551 points while the Hang Seng Index was up over 1.6% to 29452 points. This arrests some of the decline but as you can see on the daily chart its not yet out of the woods as price needs to get back above the 30000 point level or we’re setting up for a bearish head and shoulders pattern:
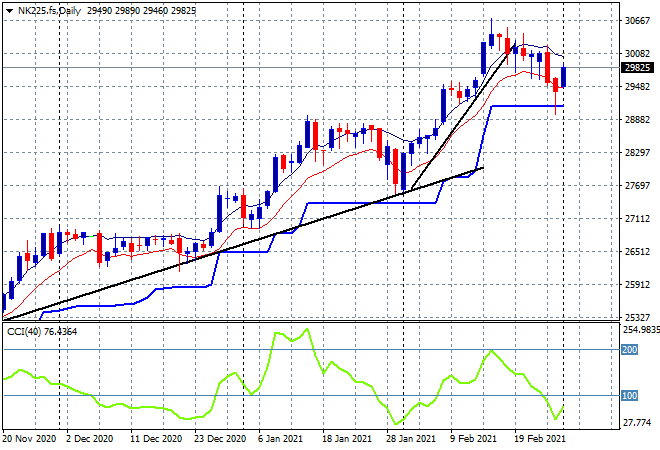
Japanese markets bounced back the hardest with the Nikkei 225 closing 2.4% higher at 29663 points. Futures are again pointing to a little more upside this morning as price will continue to bounce off trailing ATR daily support at 29000 points, although I still contend it needs to correct more down to the more sustainable trend line down nearer 28000 points:
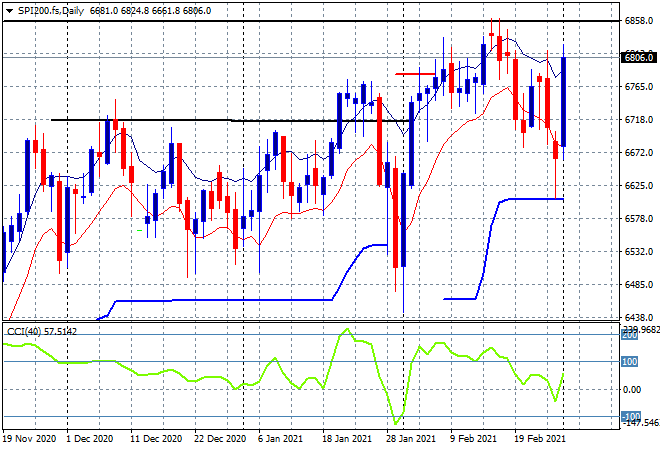
The ASX200 also took in the big bounce, lifting more than 1.7% to almost get back above the 6800 point level, closing at 6789 points and helped along with some RBA bond buying. SPI futures are up nearly 50 points in response to the big recovery on Wall Street, so this arrests almost all of the previous decline and puts daily momentum back into the positive zone – until it hits heavy resistance again below 6900 points:
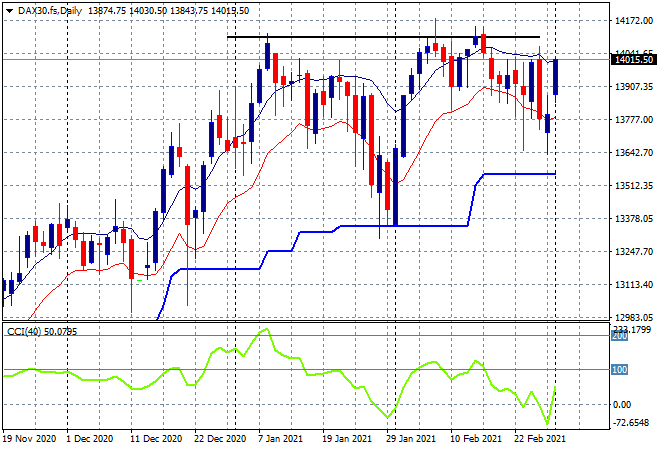
European markets all rebounded in unison, with the German DAX moved back above the 14000 point barrier, or 1.6% higher to 14012 points. Another big fill that will again come up against months long resistance, with the 14000 point level the area to watch again later tonight:
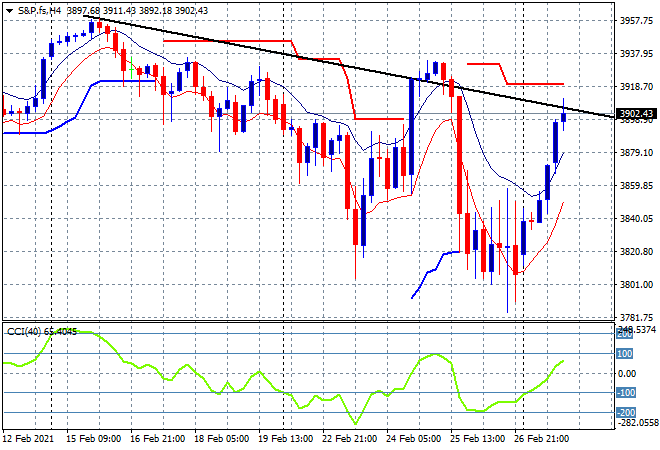
Wall Street loves a dip and the dip buyers were out in force, the NASDAQ up 3% while the DOW and S&P500 finished 2% and 2.3% higher respectively, the latter closing at 3900 points exactly. The four hourly chart showing price sitting right on the downtrend line from the mid February highs as this rally looks like a reflation only and not a sustainable move higher until that is broken and matches or exceeds last week’s high:
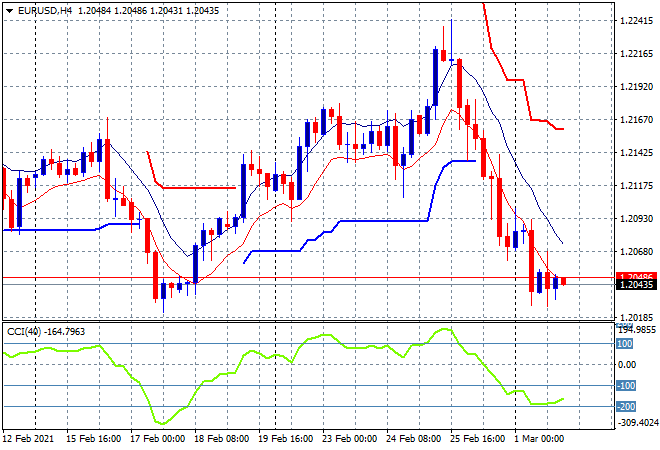
Currency markets are reducing in volatility but only just with Euro flopping yet again to match its previous weekly low, heading down to but not through the 1.20 handle overnight on the back of the German CPI print. Im watching for more intrasession volatility that could see it flop again later this evening:
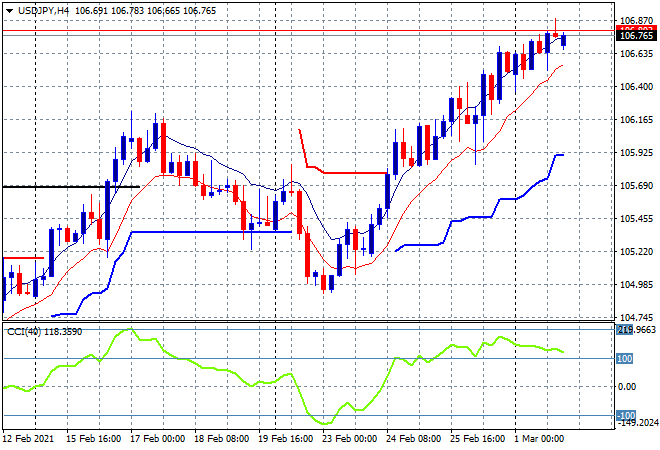
The USDJPY pair was again relatively stable but momentum is slowly waning here after being overbought for more than a week, hitting some short term resistance at the 106.80 level overnight. The next target here is the 108 handle which equates to the mid 2020 high, but we could get a small correction first:
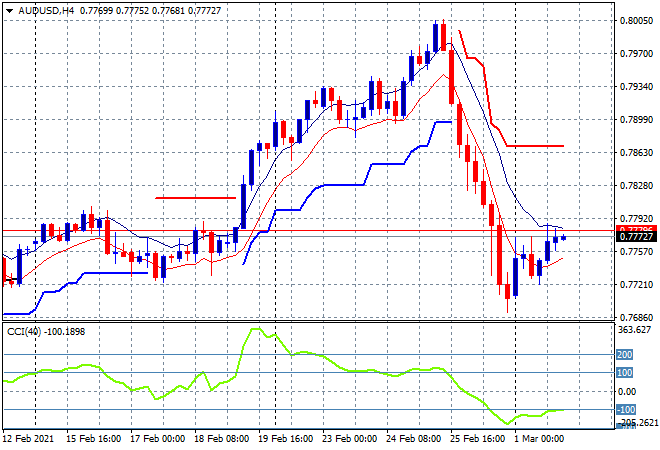
The Australian dollar was the biggest loser last week and is struggling to get going again although it shot out of the gates on Monday morning but failed to engage further overnight, sitting just below the 78 handle and still looking depressed here:
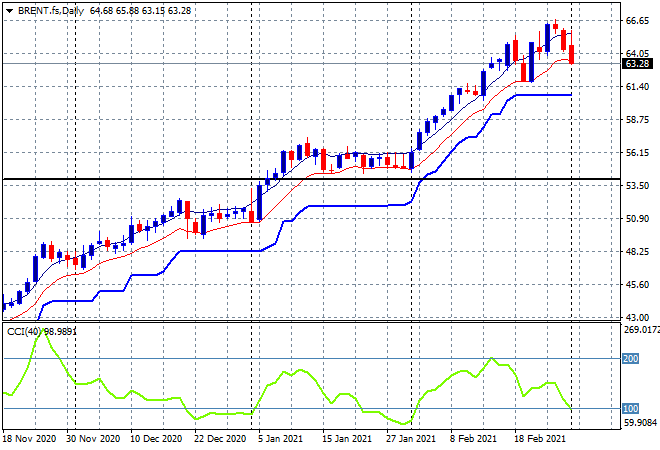
Oil prices were hit again on the stronger USD, with Brent crude slipping another 1% to start the week below the $64USD per barrel level. Is this just another wobble in the uptrend towards the main target at the $70USD per barrel at the 2019 highs, or is a cross below the low moving average on the daily chart plus momentum a sign its run out of puff? Watch ATR support closely at the $60USD level which must hold in the short term:
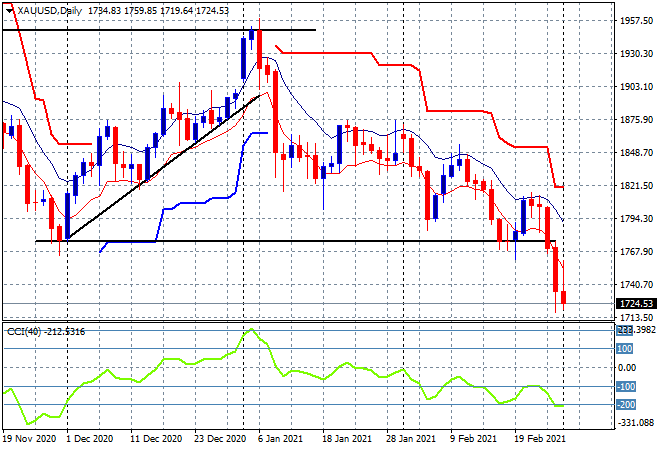
Gold continues to breakdown, with another selloff overnight on the much stronger USD, falling to another monthly low at $1723USD per ounce. Momentum is considerably oversold and there is the potential for a violent upswing here on short covering/profit taking but step back and the longer term chart is illustrative of where this can go alongside the bond shock:
Glossary of Acronyms and Technical Analysis Terms:
ATR: Average True Range – measures the degree of price volatility averaged over a time period
ATR Support/Resistance: a ratcheting mechanism that follows price below/above a trend, that if breached shows above average volatility
CCI: Commodity Channel Index: a momentum reading that calculates current price away from the statistical mean or “typical” price to indicate overbought (far above the mean) or oversold (far below the mean)
Low/High Moving Average: rolling mean of prices in this case, the low and high for the day/hour which creates a band around the actual price movement
FOMC: Federal Open Market Committee, monthly meeting of Federal Reserve regarding monetary policy (setting interest rates)
DOE: US Department of Energy
Uncle Point: or stop loss point, a level at which you’ve clearly been wrong on your position, so cry uncle and get out!