Via China’s NBS comes the February PMIs. These were weak but even more so when one considers that the great Chinese New Year people migration was effectively cancelled this year meaning more people remained at work. It may simply be that that distortion has not been picked up by the survey’s seasonal adjustments:
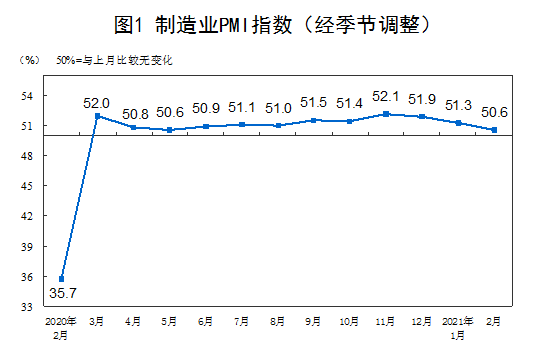
In February , China’s Manufacturing Purchasing Managers Index ( PMI ) was 50.6% , which was 0.7 percentage points lower than the previous month. It was above the threshold for 12 consecutive months, and the manufacturing industry’s prosperity level fell from the previous month.
In terms of enterprise scale, the PMI of large enterprises was 52.2% , a slight increase of 0.1 percentage point from the previous month ; the PMI of small and medium-sized enterprises were 49.6% and 48.3% , respectively , 1.8 and 1.1 percentage points lower than the previous month , which were both below the threshold.
From the perspective of sub-indices, among the five sub-indices that make up the manufacturing PMI , the production index and the new order index are all above the critical point, and the raw material inventory index, the employee index, and the supplier’s delivery time index are all below the critical point.
The production index was 51.9% , down 1.6 percentage points from the previous month and higher than the threshold, indicating that the pace of manufacturing production expansion has slowed down.
The new order index was 51.5% , down 0.8 percentage points from the previous month and higher than the threshold, indicating that the growth rate of manufacturing market demand has slowed.
The raw material inventory index was 47.7% , down 1.3 percentage points from the previous month and below the threshold, indicating that the manufacturing industry’s main raw material inventory continued to decrease.
The employment index was 48.1% , a decrease of 0.3 percentage points from the previous month , indicating a decline in the employment boom of manufacturing enterprises from the previous month.
The supplier delivery time index was 47.9% , a decrease of 0.9 percentage points from the previous month , indicating that the delivery time of manufacturing raw material suppliers has been extended.
New exit
Order
import
Purchase quantity
Purchase price of main raw materials
Factory
price
Finished product
in stock
In hand
Order
Expected production and operation activities
2020 Nian 2 Yue
28.7
31.9
29.3
51.4
44.3
46.1
35.6
41.8
2020 Nian 3 Yue
46.4
48.4
52.7
45.5
43.8
49.1
46.3
54.4
2020 Nian 4 Yue
33.5
43.9
52.0
42.5
42.2
49.3
43.6
54.0
2020 Nian 5 Yue
35.3
45.3
50.8
51.6
48.7
47.3
44.1
57.9
2020 Nian 6 Yue
42.6
47.0
51.8
56.8
52.4
46.8
44.8
57.5
2020 Nian 7 Yue
48.4
49.1
52.4
58.1
52.2
47.6
45.6
57.8
2020 Nian 8 Yue
49.1
49.0
51.7
58.3
53.2
47.1
46.0
58.6
2020 Nian 9 Yue
50.8
50.4
53.6
58.5
52.5
48.4
46.1
58.7
2020 Nian 10 Yue
51.0
50.8
53.1
58.8
53.2
44.9
47.2
59.3
2020 Nian 11 Yue
51.5
50.9
53.7
62.6
56.5
45.7
46.7
60.1
2020 Nian 12 Yue
51.3
50.4
53.2
68.0
58.9
46.2
47.1
59.8
2021 Nian 1 Yue
50.2
49.8
52.0
67.1
57.2
49.0
47.3
57.9
2021 Nian 2 Yue
48.8
49.6
51.6
66.7
58.5
48.0
46.1
59.2
2. Operation of China’s non-manufacturing purchasing managers’ index
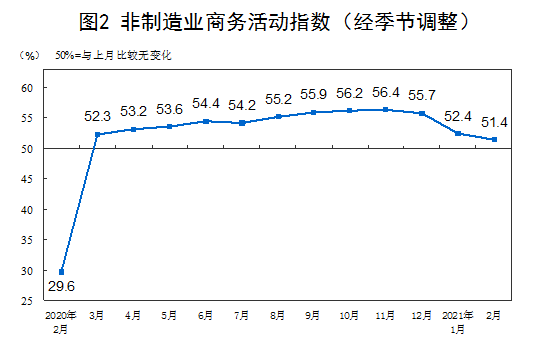
In February , the non-manufacturing business activity index was 51.4% , a decrease of 1.0 percentage point from the previous month , indicating that the pace of non-manufacturing expansion has slowed down.
In terms of different industries, the business activity index of the construction industry was 54.7% , 5.3 percentage points lower than last month . The service industry business activity index was 50.8% , 0.3 percentage points lower than last month . From the perspective of the industry, the business activity index of railway transportation, telecommunications, radio and television satellite transmission services, Internet software and information technology services, currency and financial services, ecological protection and environmental governance are in the high-prosperity range of 55.0% and above; accommodation and capital markets The business activity index of the services, leasing and business services industries is below the critical point.
David Llewellyn-Smith is Chief Strategist at the MB Fund and MB Super. David is the founding publisher and editor of MacroBusiness and was the founding publisher and global economy editor of The Diplomat, the Asia Pacific's leading geo-politics and economics portal.
He is also a former gold trader and economic commentator at The Sydney Morning Herald, The Age, the ABC and Business Spectator. He is the co-author of The Great Crash of 2008 with Ross Garnaut and was the editor of the second Garnaut Climate Change Review.