
The short squeeze continued on Wall Street Friday night as the Gamestop debacle spilled over into a selloff across the board on both sides of the Atlantic as nominal gains for the year evaporated. The USD remained strong against most of the majors, although gold and silver are showing signs of life with the latter possibly the next target for the Reddit crowd. German unemployment was unexpectedly higher while US core inflation picked up slightly too. The real kicker is volatility – we might be seeing my idea of a return of the 2020 February correction repeated here in 2021….
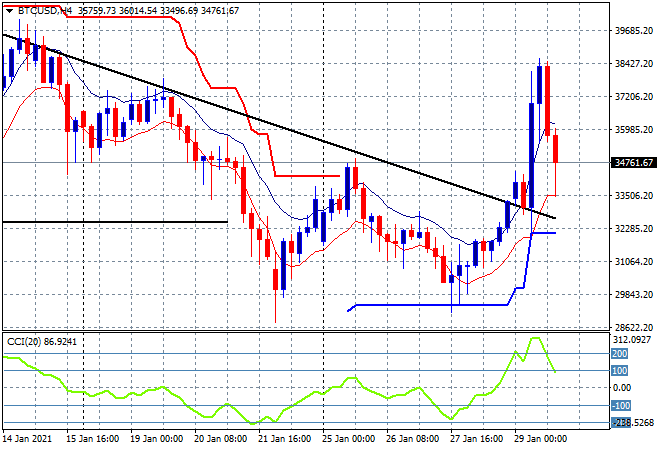
Bitcoin had a massive surge up through to the $38K level before reversing course to finish at the just below the $35K level in a wild day of days! The weekend trade looks set to see more volatility come Monday morning, as this could be nothing more than a false breakout:
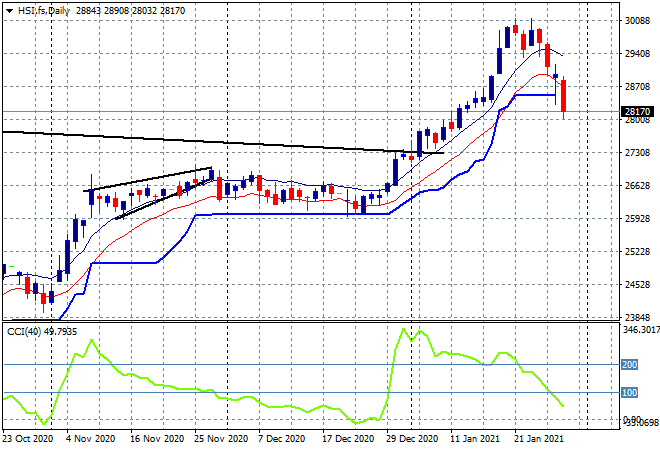
Looking at share markets in Asia from Friday’s session where the Shanghai Composite fell below the 3500 point level for the first time this year, falling some 0.6% to 3483 points, while in Hong Kong the Hang Seng Index also pushed sharply lower, down 0.9% to close at 28283 points. The daily chart shows this pullback is turning into a rout with daily trailing ATR support broken and daily momentum inverting, but not yet negative. Price needs to stabilise at the 28000 point level very quickly:
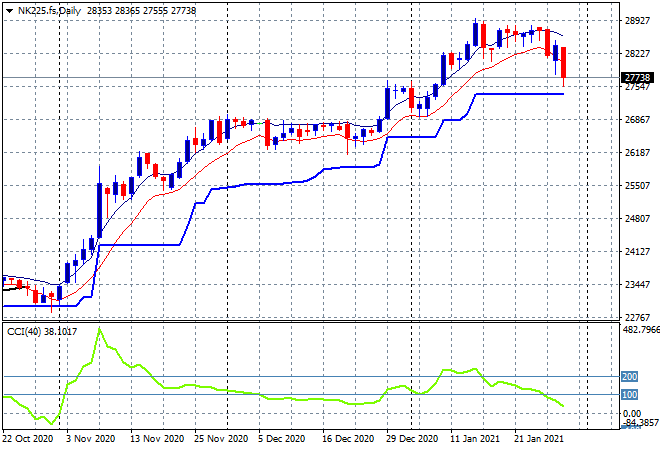
Japanese markets also dialed in a new low for year, with the Nikkei 225 falling nearly 2% lower to 27663 points. Risk correlation is key again with Wall Street pulling back so sharply, as daily ATR support at the 27500 point level the next area to be wary of breaking here:
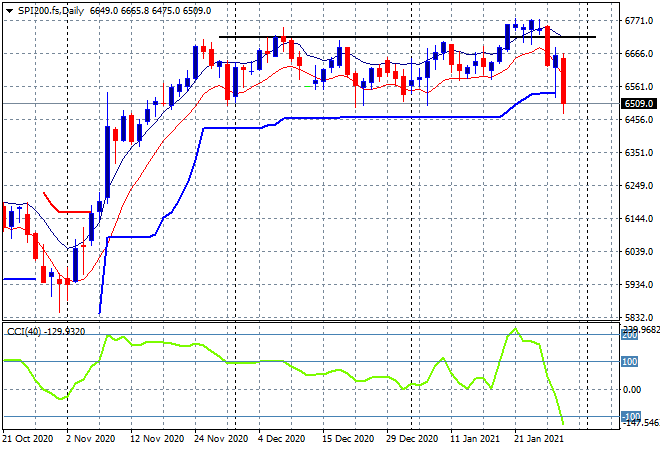
The ASX200 was the best out of the bunch, only falling 0.6% to close at 6607 points, not helped at all by the lower Australian dollar. SPI futures show deep selling with an open around the 6500 point are that could wipe out the bullish rectangle pattern on the daily chart and have us slide all the way back to pre-Biden days:
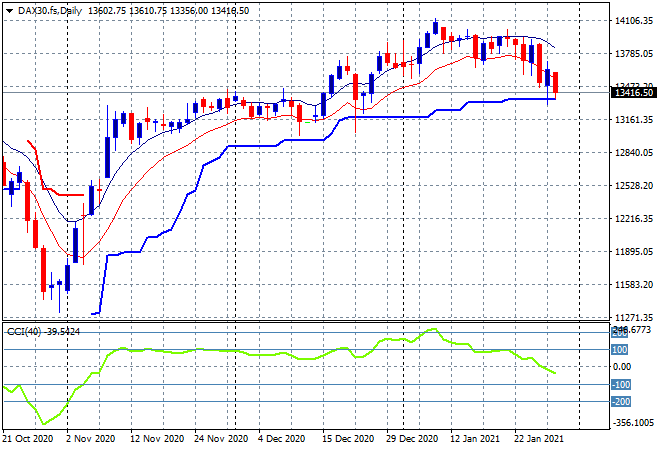
European markets fell sharply at the open, but this time were unable to claw their way back as Wall Street opened deep in the red too. The German DAX finished 1.7% lower to 13432 points with yet another market ready to break through daily ATR support, with the 13200 point level the next area to watch carefully:
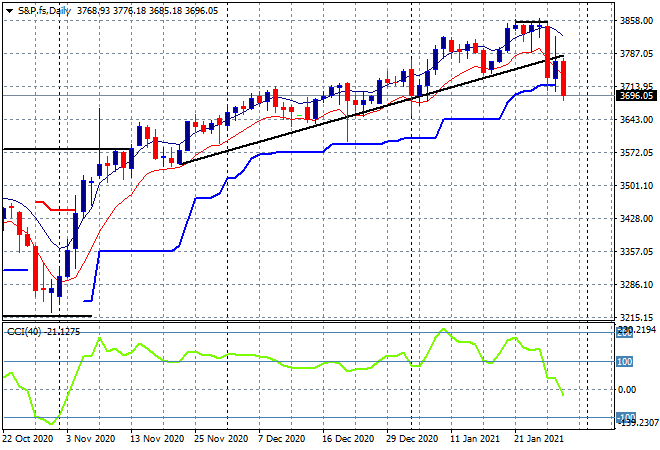
Wall Street fell sharply across the board with the NASDAQ down exactly 2% while the S&P500 did almost the same, falling 1.9% to close the week at 3715 points, also having wiped out all of January’s returns. The daily chart now shows a clear break of the post election trendline with daily ATR support bnominally take out as well. The shorts are going to pile in here with my target the early November pre-breakout level at around 3500 points:
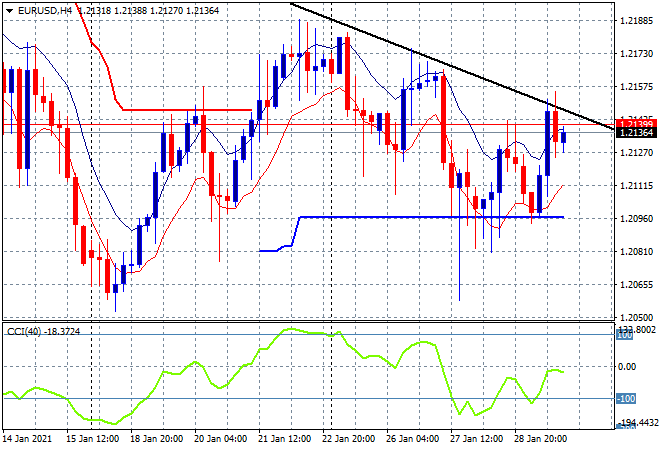
Currency markets continue to absorb most of this volatility with Euro pushing slightly higher but now above to break the downtrend line from the previous weekly highs. The daily chart shows another return above the 1.21 handle but there’s still a lot of intrasession selling going on with momentum not yet positive here, so we could see another quick rollover and selloff:
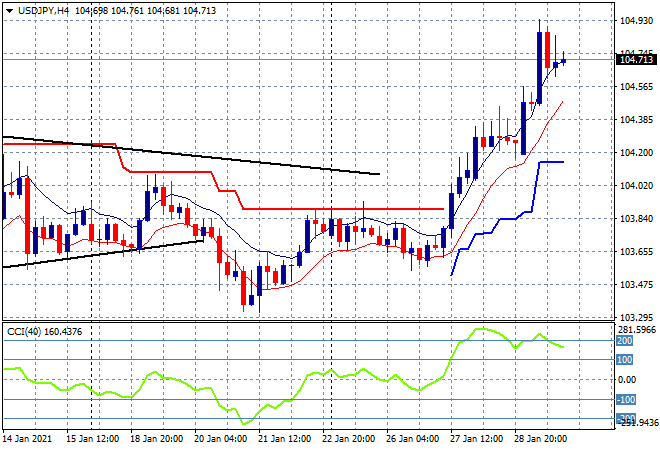
The USDJPY breakout continues apace, almost getting through the 105 handle after breaking through medium term resistance at the 104 level, but is slowing down here. The four hourly chart shows momentum at high overbought levels but price remains firm around the high moving average and not yet under threat, despite the need for more Yen safe haven buying:
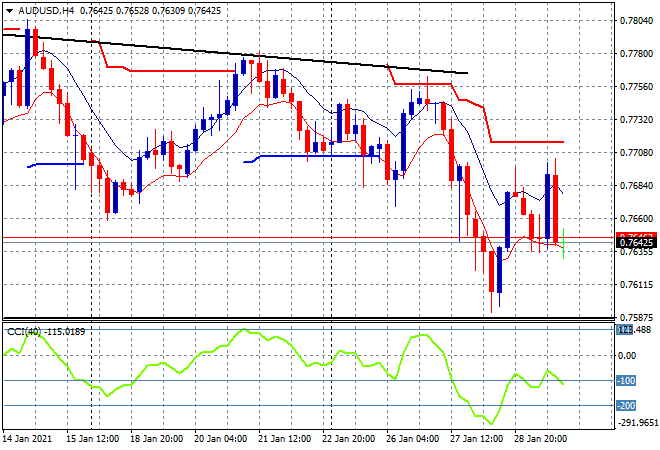
The Australian dollar had the most volatile session however, with a push back towards the 77 handle thwarted again with a selloff back down towards the low 76s with signs of more weakness building here. I’m still expecting another rollover soon:
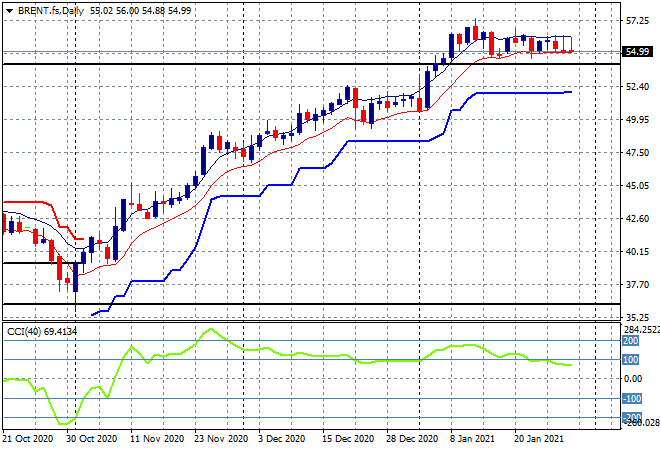
Oil prices continue to slowly deflate again as the slightly weaker with Brent slipping again below the $55USD per barrel level and failing to make a new daily high for more than two weeks now. Price remains stalled just above the pre COVID February 2020 level (upper horizontal black line) with strong medium term support remaining firm even as momentum wanes, but I would contend this low volatility means higher volatility soon:
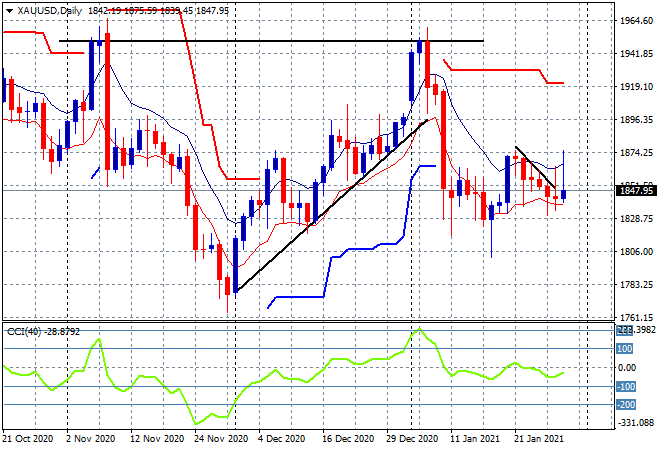
Gold prices remain extremely messy even on the daily chart with yet another potential breakout thwarted and round tripped back down to the $1850USD per ounce level. There was potential for another breakout above $1875 or so to get back to the previous monthly highs at $1950 but it all depends on short term support at $1830 holding:
Glossary of Acronyms and Technical Analysis Terms:
ATR: Average True Range – measures the degree of price volatility averaged over a time period
ATR Support/Resistance: a ratcheting mechanism that follows price below/above a trend, that if breached shows above average volatility
CCI: Commodity Channel Index: a momentum reading that calculates current price away from the statistical mean or “typical” price to indicate overbought (far above the mean) or oversold (far below the mean)
Low/High Moving Average: rolling mean of prices in this case, the low and high for the day/hour which creates a band around the actual price movement
FOMC: Federal Open Market Committee, monthly meeting of Federal Reserve regarding monetary policy (setting interest rates)
DOE: US Department of Energy
Uncle Point: or stop loss point, a level at which you’ve clearly been wrong on your position, so cry uncle and get out!